Investigation of Outbreaks


Investigation of Outbreaks


William R. Jarvis


Although the majority of healthcare-associated infections (HAIs) in a given healthcare facility are endemic (1), outbreaks of HAIs may occur, usually in a specific group of patients or location. In addition, healthcare workers (HCWs) are exposed to numerous infectious agents and may be at risk of spreading pathogens to patients and other HCWs (2, 3, 4).

An outbreak is an increase in occurrence of an event (infectious or noninfectious) above the background rate. This assumes that surveillance for such complications exists, so that a background rate is known or can be calculated from existing data. If such data do not exist, then a retrospective review must be performed to obtain these data to calculate the rate of these adverse events to compare to the “outbreak” rate. An outbreak may be one episode of a rare occurrence (e.g., group A streptococcal surgical site infection [SSI], anthrax, and vancomycin-resistant Staphylococcus aureus) or many episodes of a common occurrence (e.g., methicillin-resistant S. aureus [MRSA] infection). Outbreaks in healthcare facilities, although infrequent, can cause great concern, require extensive personnel and financial resources to investigate and control, generate adverse publicity, negatively impact on patient safety, and can be very time-consuming.

This chapter helps healthcare epidemiologists, infection preventionists, and others to determine when a cluster of infections or other adverse events among patients or HCWs merits an epidemiologic investigation and how to conduct such an investigation. Although the methods described can be applied to infectious diseases, chronic diseases, community outbreaks, occupational diseases or injuries, or any complication of healthcare delivery, this chapter focuses on outbreak investigations of HAIs.


IDENTIFICATION OF A POTENTIAL OUTBREAK

Routine surveillance for HAIs provide the data to enable infection control personnel to calculate infection or other adverse event rates, determine secular trends, and identify unusual pathogens or events, or increased infection or adverse event rates in patients or HCWs (see Chapter 88). The key to effective surveillance is to use common, accepted definitions and to calculate rates that permit valid interfacility or intrafacility comparisons (5, 6, 7, 8, 9) (http://www.cdc.gov/nhsn/PDFs/pscManual/17pscNosInfDef_current.pdf). Rate calculations using an inappropriate denominator may be misleading and suggest an outbreak is occurring when only a change in the population at risk has occurred. Similarly, the use of variably defined numerator events may lead to an apparent increase in the rate secondary to surveillance artifact. Outbreaks of infectious diseases that are not included in routine surveillance or that occur among patients in areas where routine surveillance may not be conducted may be identified in a variety of ways. Clinical nursing or medical staff may recognize that a number of patients have the same type of infection or regular examination of microbiology or other records may reveal an increase in the isolation of a particular microorganism, thus leading to the identification of a potential outbreak.


REASONS TO INVESTIGATE A POTENTIAL OUTBREAK


Objectives

Although any cluster of patients with HAIs can be investigated, the constraints of time and resources require that each investigation has specific objectives. The most important of these is the control of further transmission (10). Other important objectives may be to advance the field of healthcare epidemiology and infection control by describing etiologic agents, host, risk factors, virulence, or environmental factors; to assess prevention interventions; or to determine the quality of epidemiologic surveillance at the healthcare facility (11).


Evidence of HAI Transmission of Infectious Diseases

HAI transmission should be considered when (a) a cluster of similar infections occurs on one hospital unit or among similar patients, (b) a cluster of infections associated with invasive devices occurs, (c) HCWs and patients develop the same type of infection, or (d) a cluster of infections with microorganisms typically associated with HAIs (e.g., multidrug-resistant or opportunistic microorganisms)
occurs. These clusters merit investigation to determine if HAI transmission really is occurring and to institute appropriate control measures to terminate pathogen transmission. Selection bias frequently occurs in identifying outbreaks because unusual pathogens, or common microorganisms with unusual antimicrobial susceptibility patterns, are more easily recognized. For example, although Escherichia coli urinary tract infection outbreaks probably occur, they are either not recognized or not investigated, because the microorganism is the most common cause of urinary tract infection and typing of the genotying of strains—to document clonal transmission—usually is not performed. In contrast, a small cluster of unusual pathogens or common pathogens with unusual antimicrobial susceptibility patterns are easily and frequently recognized.


Determination of Risk Factors for Disease

Known host risk factors for HAI include the presence of invasive devices, severity of illness, or underlying diseases (12, 13, 14). In addition, environmental sources of pathogens can play a role, especially among immunocompromised patients (15, 16, 17, 18, 19). Investigation of outbreaks can further define both host and environmental risk factors for HAI. Infection control personnel should be constantly vigilant for complications associated with new technologies or changes in previously safe technologies (20,21, 22, 23).


Institution of Appropriate Control Measures

In outbreak situations, one often must introduce preventive interventions to control pathogen transmission and adverse outcomes before an investigation is initiated or completed. Control measures that have proven effective in similar HAI outbreaks in the past can be implemented immediately. This could include measures ranging from the simple (e.g., enhancing hand hygiene through in-service education sessions for personnel) to the complex (e.g., closing a unit to new admissions or removing a product or device). The potential benefit of more drastic measures should be carefully weighed against the potential harm to patients currently residing in the facility. Subsequently, the formal epidemiologic investigation of the outbreak may help focus control measures on specific infection control or procedural techniques (10).


FIRST STEPS

Once an outbreak is suspected and an investigation is contemplated, all levels of the healthcare facility’s personnel (e.g., the chief of the affected service, head nurse for the unit, director of microbiology, and hospital administration) should be informed and must be committed to the investigation. The cooperation of a variety of healthcare professionals is essential to efficiently conduct an investigation and to implement control measures.

A second consideration during the early stages of an outbreak investigation is the availability of microbiologic isolates for antimicrobial susceptibility testing or molecular or nonmolecular typing. Unlike community outbreaks, typing of microorganisms in HAI outbreaks may be essential to proving chains of transmission because of the ubiquitous nature of microorganisms in the hospital environment (18,24). For this reason, microbiology laboratory personnel should be informed early in the investigation so that they can save requested specimens or isolates and be alert for additional isolates that may be part of the outbreak. Laboratory personnel also may suggest other specimens that should be collected from current or future patients who develop the adverse event being studied.

Finally, before beginning an investigation, available resources (e.g., personnel, supplies, and laboratory), the lead investigator, and the person to be responsible for statistical analysis of the data should be identified. Taking these steps before initiating an investigation will allow it to proceed smoothly later.


THE INVESTIGATION

A complete investigation involves many steps; the order of steps may vary and multiple steps may be performed simultaneously. These steps, although not specific to the healthcare setting, are a useful guide in conducting an outbreak investigation (Table 8-1).


Case Definition

One of the first tasks of the investigative team is to develop a working case definition based on the known facts of the outbreak. The case definition should include, at a minimum, the time, place, and person. In addition, other important factors, such as clinical and laboratory parameters (e.g., date of onset of illness, symptoms, signs, and
specific laboratory or diagnostic findings), epidemiologic parameters (e.g., a patient’s presence on a specific ward or service during a specified time) may be included. In certain instances, one may include confirmed, possible, or probable cases of disease. The process of developing case definitions is an iterative one and should be based on balancing the need for an all-inclusive (sensitive) case definition at the beginning of the investigation and more specific case definition as the investigation proceeds and more data are acquired. Case definitions may vary from the relatively simple to very complex (21,25) (Table 8-2). Occasionally, the case definition may need to be refined as the investigation proceeds and more data are acquired.


TABLE 8-1 Guidelines for Epidemiologic Field Investigations


  1. Prepare for field work (e.g., administration, clearance, travel, contacts, and designation of lead investigator)


  2. Confirm the existence of an epidemic


  3. Verify the diagnosis


  4. Identify and count cases or exposures


    • Create a case definition


    • Develop a line listing


  5. Tabulate and orient the data in terms of time, place, and person


  6. Take immediate control measures (if indicated)


  7. Formulate hypotheses


  8. Test hypotheses through epidemiologic studies


  9. Plan an additional systematic study (or studies)


  10. Culture environment and personnel based on epidemiologic data


  11. Implement and evaluate control and preventive measures


  12. Initiate surveillance


  13. Communicate findings


    • Summarize investigation for requesting authority


    • Prepare written report(s)


(Modified from Goodman RA, Buehler JW, Koplan JP. The epidemiologic field investigation: science and judgement in public health practice. Am J Epidemiol 1990;132:9-16.)


TABLE 8-2 Examples of Case Definitions from Hospital Outbreaks Investigated by the CDC’s Hospital Infections Program/Division of Healthcare Quality Promotion


  1. “A case of multidrug-resistant tuberculosis was defined as any patient diagnosed with active tuberculosis from January 1989 through March 1991 whose M. tuberculosis isolate was resistant to at least isoniazid and rifampin” (35).


  2. “An [anaphylactic reaction] was defined as hypotension (≥30 mm Hg fall in systolic blood pressure from the preinduction blood pressure) and at least one of the following during a general anesthesia procedure at hospital A from January 1989 through January 1991: rash, angioedema, stridor, wheezing, or bronchospasm” (21).


CDC, Centers for Disease Control and Prevention.


Case Finding

Once an initial case definition has been developed, additional case finding can be conducted. The case definition should be applied to the source population without bias as to known or potential underlying host or environmental risk factors. Sources most commonly used for finding cases are discharge diagnosis or International Classification of Disease codes; microbiology, infection control, or transfusion records; emergency room, outpatient clinic, or dialysis clinic logs; or patient medical records in a cohort study—if the cases are limited to a single ward/unit or if the healthcare facility is very small (i.e., where charts can be reviewed in a short period).


Confirming an Outbreak

Confirming an outbreak begins with calculating the background rate of infection or adverse event and then comparing the outbreak period rate with the background rate. The outbreak period should include the time period from the possible incubation period for the first case of adverse event until the last case or time of the investigation. The background rate of the adverse event should be based on existing data, which can be collected from a variety of resources, including microbiology, infection control, or patient records. Data may have to be collected for a period of many months to years preceding the outbreak to determine an accurate background rate, particularly if the adverse event has a seasonal periodicity. Comparison of the outbreak period attack rate to the background rate can be performed using the rate ratio:


Pseudo-outbreaks are increases in the incidence of infections or adverse events that are not real. This can be due to false clusters of real infections/adverse events or real clusters of false infections/adverse events. Possible causes can be (a) clusters of positive cultures in patients without evidence of infection/disease (e.g., positive cultures for Mycobacterium tuberculosis in a patient with no clinical evidence of tuberculosis) or (b) a perceived increase in infections/adverse events because either the specific laboratory test had not been used (e.g., introduction of polymerase chain reaction testing for MRSA or Clostridium difficile) or surveillance was not previously being conducted for that particular problem or surveillance definitions, intensity, or methods have changed. Pseudo-outbreaks usually are due to either increased surveillance of an area or type of infection or laboratory errors (i.e., extrinsic or cross-contamination) (26, 27, 28, 29). Hypotheses developed during the investigation of a presumed outbreak should include the possibility of a pseudo-outbreak, particularly if laboratory clustering of the positive cultures occurs (see Chapter 9).


Chart Review

Before beginning the lengthy process of reviewing medical records, one should determine which data are important to collect for each case-patient or case-HCW and design a questionnaire for ease of data collection (see Chapter 5 for details on questionnaire design). Some important categories of information to consider in most investigations are demographic variables (e.g., age gender, race, or ethnicity), underlying illnesses, severity of illness indicators (e.g., Acute Physiology and Chronic Health Evaluation or Pediatric Risk of Mortality scores) (30,31), ward/unit, duration of hospitalization; exposures to invasive devices or procedures, personnel or other patients, or medications; and clinical aspects of the disease/adverse event being studied (e.g., date of onset of illness, symptoms, and signs). For SSI outbreaks, surgical risk factors (e.g., procedure, operating room, surgeon, or surgical team members) or surgical risk index (7,32) must also be determined in addition to the other categories.


Descriptive Epidemiology

A line listing of the case-patients and pertinent demographic and clinical information serves as a useful tool to begin the process of describing the outbreak in terms of time, place, and person. Describing an outbreak in this way helps determine who is at particular risk for the adverse event that is being studied. In turn, knowing which
population of patients or HCWs is at risk determines who should be included in further analytic studies.


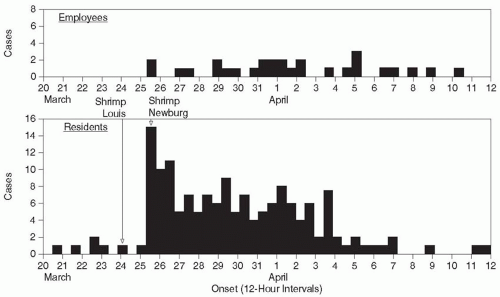
FIGURE 8-1 Epidemic curve from a common source outbreak with subsequent person-to-person transmission. (From Gordon SM, Oshiro LS, Jarvis WR, et al. Foodborne Snow Mountain agent gastroenteritis with secondary person-to-person spread in a retirement community. Am J Epidemiol 1990;131:702-710.)

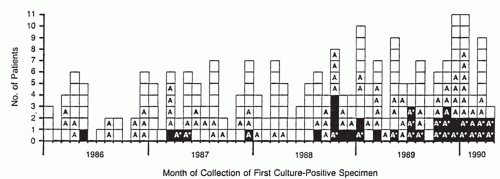
Describing the outbreak over time is most easily done by graphing the case-patients or case-HCWs by onset of disease; the cases can be graphed by time (e.g., hours, days, months, or quarters), as appropriate. These graphs, often called epidemic or epi curves, can provide a great deal of information about possible sources and modes of transmission. For example, a common-source outbreak with subsequent person-to-person transmission is well illustrated by a foodborne outbreak in a retirement community (33) (Fig. 8-1). A high initial peak of onset of illness, indicating a point source of infection, followed by continued cases of illness is typical of an outbreak of gastrointestinal illness caused by a viral agent. Person-to-person transmission, on the other hand, usually is illustrated by an epidemic curve of longer duration with few, if any, peaks. A typical epidemic curve illustrating person-to-person transmission would be an outbreak of M. tuberculosis HAIs (34) (Fig. 8-2).


FIGURE 8-2 Epidemic curve illustrating person-to-person transmission. (From Edlin BR, Tokars JI, Grieco MH, et al. An outbreak of multidrug-resistant tuberculosis among hospitalized patients with the acquired immunodeficiency syndrome. N Engl J Med 1992;326:1514-1521.)

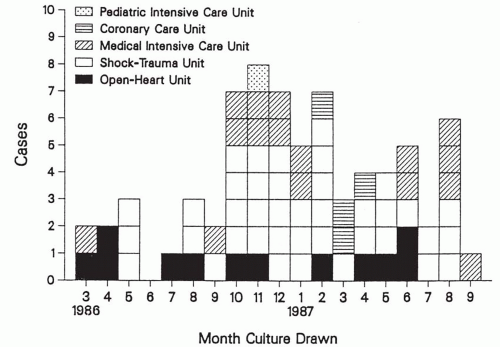
The epidemic curve of an outbreak caused by poor adherence to recommended infection control practices (e.g., poor hand hygiene compliance) or contaminated patient-care equipment also usually are spread over a long period. For example, an Acinetobacter baumannii outbreak related to reusable intravascular transducers that were not adequately sterilized between uses on different patients continued for over a year until the problem was recognized and the decontamination and disinfection technique was corrected (18) (Fig. 8-3). If HCWs and patients are both
affected by the outbreak, the dates of onset of disease/adverse event for patients and HCWs should be plotted both together and separately to determine if transmission occurred from patient to patient, patient to HCW, HCW to patient, or HCW to HCW.


FIGURE 8-3 Epidemic curve of an outbreak caused by contaminated patient-care equipment. (From Beck-Sague CM, Jarvis WR, Brook JH, et al. Epidemic bacteremia due to Acinetobacter baumannii in five intensive care units. Am J Epidemiol 1990;132:723-733.)

At times, the location of the outbreak is limited to a certain ward, unit, or operating room and at other times to a certain type of ward (e.g., general surgical units). The location of the outbreak may provide a clue to the mode of transmission or to certain risk factors or exposures of particular patients.

For example, an investigation in a hospital with high tuberculin skin test (TST) conversion rates among patients and HCWs revealed that many of the TST converters were patients of or workers in the outpatient human immunodeficiency virus (HIV) clinic (35). The clinic had a large room with reclining chairs for patients with acquired immunodeficiency syndrome (AIDS) to receive intravenous medications on an outpatient basis. This room was immediately adjacent to two rooms with floor-to-ceiling sliding glass doors, in which aerosolized pentamidine was administered to patients with Pneumocystis carinii pneumonia; some of these patients had active tuberculosis. Because these treatment rooms were under positive pressure relative to the intravenous medication room, patients receiving intravenous medications, and HCWs administering the medications, were exposed to patients with M. tuberculosis infection when HIV-infected patients with active tuberculosis received aerosolized pentamidine. This occurred even if the isolation room doors were closed. In addition, air in the isolation rooms and waiting area was recirculated, causing a mixture of clean and potentially M. tuberculosis contaminated air to be circulated through the room. Thus, the location of a number of the cases led to identification of risk factors for acquisition of the disease (i.e., new onset of tuberculosis or TST conversion among AIDS clinic patients or HCWs exposed to patients with active tuberculosis) and to mode of transmission (airborne spread caused by poor isolation practices and inadequate ventilation systems).

By describing the case-patients in terms of demographics and underlying disease, one can define the at-risk population and determine possible exposures. Certain patient populations may be at risk because of either age or underlying disease-specific exposures. The entire population that meets these identified criteria is the group of patients that would have been identified as case-patients had they developed disease (36). This is the population from which controls or the cohort to be studied should be chosen for epidemiologic studies. The comparison population (controls or noncases) should have the same opportunity for infection/disease or adverse event as the case-patients.


Developing Hypotheses

Once cases are identified, and pertinent information from the medical records is abstracted, hypotheses about the cause of the outbreak can be generated. These hypotheses should be based on the available information, previously published literature, and expert opinion. Then, epidemiologic studies can be conducted to test the hypotheses.

In many situations, the number of cases in the cluster is very small (less than five cases) or personnel or financial resources are not sufficient to conduct epidemiologic hypothesis testing studies. Thus, a different approach, sometimes called “quick and dirty,” is followed. In this situation, the line listing of the case-patients, which flowed from the case definition and case finding, is examined,
commonalities identified, and hypothesis generated about the most probable sources and mode of transmission. Then, a variety of control measures are implemented aimed at the most probable source and mode of transmission. After implementing these control measures, one continues to conduct surveillance for additional case-patients and one hopes that the outbreak is terminated. If the outbreak continues, either additional control measures may be implemented or it may be necessary to conduct the hypothesis testing epidemiologic studies.


Testing Hypotheses

Investigation of outbreaks is by nature retrospective to the development of the adverse event. Two types of retrospective analytic studies can be performed to test hypotheses formed in an outbreak investigation: case-control or cohort studies. Recently, such studies have been called “quasi-experimental” studies, as they are not prospective, randomized, placebo-controlled studies. The majority of recommendations for prevention of HAIs are based on such quasi-experimental studies. Each type of study (e.g., case-control or cohort) has inherent advantages and disadvantages, which should be taken into account before embarking on the study. A major consideration is whether the number of case-patients is sufficient to statistically identify or confirm the source and risk factors for infection/disease or adverse event (i.e., the statistical power of the study). If the number of cases is small, an epidemiologic study may be fruitless, as one may not identify a source or risk factor that is responsible (type II or beta error) or erroneously identify a source or risk factor that is not responsible (type I or alpha error).

Case-Control Studies The case-patients for a case-control study have already been selected by the occurrence of the outbreak. Choosing the appropriate controls is the next step. Case-control studies require the selection of study participants on the basis of disease/infection/adverse event status. For example, if 25 affected patients or HCWs (case-patients) are enrolled, a proportional number (25, 50, 75, etc.) of unaffected members of the at-risk population should be enrolled as controls. Specific risk factors for disease/adverse event then can be compared between case- and control-patients. Care should be taken to ensure that case-patients and control subjects have equal likelihood of the exposure (e.g., presence on the unit/ward for minimum lengths of time during which the potential source may have been present).

The main advantage of case-control studies is that they require a small number of subjects (cases [n] and controls [1n, 2n, or 3n]) and can, therefore, be conducted relatively quickly. In addition, because subjects are chosen on the basis of their disease/adverse event status (i.e., cases being ill and controls being well), case-control studies are well suited for infrequent or rare diseases/adverse events or diseases/adverse events with long latency periods. In addition, multiple exposures can be examined in the course of one study. This same feature, however, means that the design is backward (i.e., one selects subjects on the basis of disease/adverse event status and then looks backward in time to look at potential exposures). This may lead to uncertainty that the exposure actually preceded the onset of disease/adverse event. In addition, this backwardness may subject the study to both selection and recall bias. Another disadvantage of case-control studies is that they are unsuitable for rare exposures (disease/adverse event incidence rates cannot be measured because the population at risk has not been proportionately sampled) (see also Chapter 2). Most outbreak investigations use the case-control study design because of its efficiency (smaller number of case- and control-patients medical records to review) while still being able to assess multiple exposures/potential risk factors in one study. One disadvantage of the case-control study is that one cannot determine the relative risk (RR) of the identified exposures, but rather estimates this risk by calculating the odds ratio (OR) (see also Chapter 2).

Cohort Studies In contrast to case-control studies, cohort studies require the selection of study participants on the basis of exposure status. Such status can be determined on the basis of known facts about the case-patients or case-HCWs. Exposures that often are used to determine the cohort to be studied are underlying disease, being hospitalized on a particular ward, having a particular physician, or having undergone a particular surgical or invasive procedure. Once the cohort of diseased (cases) and nondiseased (noncases) patients is selected, specific risk factors for development of disease can be evaluated among the cases and noncases.

Because cohort study subjects are selected on the basis of an exposure and followed forward through time (albeit historical time) for the occurrence of disease, cohort studies have the advantage of a logical temporal sequence. The selection of subjects on the basis of exposure also facilitates studying rare exposures or the many effects of one exposure. Another major advantage of the cohort study design is the ability to calculate disease incidence rates for the affected population and the RR associated with the identified risk factors (see also Chapter 2).

Study Design The type of study that should be done and the population from which study subjects should be chosen depend on the particular hypotheses to be tested, the frequency of the adverse event, the duration of the outbreak, the number of case-patients identified, and so forth. Often, it is necessary to conduct several studies, each testing hypotheses from the different levels of the outbreak. Most of the data for the case-patients or case-HCWs for either type of study have already been collected in the initial data collection and chart review procedure. The same data should be collected for the control subjects (case-control study) or non-case-patients (cohort study), so that particular risk factors can be evaluated. Data should be collected similarly for cases and for controls or noncases.


Data Analysis

Descriptive Statistics Initial data analysis should consist of descriptive statistics (e.g., frequency tables for each independent or exposure variable). For example, if information collected for cases and controls or noncases includes age, gender, hospital ward, attending physician, and surgical procedure performed, the frequency of all of the values of those variables should be examined for the study population. This type of descriptive information is
very useful to direct further analyses. For example, if the study population was exposed to attending physicians A, B, and C as shown in Table 8-3, further analyses might be conducted around events associated with attending-physician A.


TABLE 8-3 Frequency Distribution of Attending Physicians for Cases and Controls, Outbreak of Unknown Disease, Hospital X


Physician


Number of Cases


Number of Controls


A


14 (93%)


7 (47%)


B


0 (0%)


0 (0%)


C


1 (7%)


8 (53%)


Total


15 (100%)


15 (100%)


Univariate Analysis: Categorical Variables Categorical variables (i.e., variables with values that can be sorted into categories such as ill or well, yes or no, male or female) are compared using the 2 × 2, or cross-tabulation, table. If a case-control study design has been used, ORs should be calculated by using the following formula:

OR = ad / bc

The OR is the odds that a person with the disease/adverse event was previously exposed to the risk factor of interest compared with the odds that a person without the disease/adverse event was not previously exposed to the risk factor of interest. Usually, the further away from 1.0 in either direction, the stronger the association between the variables. The OR estimates the RR (see later) when a case-control study design has been used. To continue with the previous example, if exposure to physicians A and C is compared with case or control status, exposure to physician A is associated with illness (Table 8-4).

When using a cohort study design, RR estimates can be calculated for the population, using the following equation:

RR = probability of being exposed divided by probability of being nonexposed or


TABLE 8-4 Two-by-Two Table Comparing Physicians A and C to Case-Control Status, Outbreak of Unknown Disease, Hospital Xa


Cases


Controls


Total


Physician A


14


7


21


Physician C


1


8


9


15


15


30


aOdds ratio = ad/bc = (14)(8)/(7)(1) = 16.


The RR is the risk of development of the disease/adverse event if the exposure has occurred compared with the risk of development of the disease/adverse event if the exposure has not occurred. As with the OR, the further away from 1.0 the RR is, the stronger the association is between the variables. This calculation assumes that the study subjects have been selected on the basis of exposure; therefore, this calculation can only be used with a cohort study design.

Most statistical software packages also calculate 95% confidence limits (95% CI) around the OR or the RR. This calculation indicates that if the population were resampled a number of times, the OR or RR would fall within the calculated confidence limits 95% of the time. If the confidence limits surround 1.0, it is likely that for any given sample of the population, the real odds of disease/adverse event or RR could equal 1.0, indicating no association between the variables. Thus, 95% CIs are one indication of the significance of the OR or RR (see also Chapter 2).

Most statistical software packages also calculate a chi-square test from the 2 × 2 table to test the association between the variables. More commonly reported in the scientific literature than the chi-square value is the p value, which is based on the chi-square value. If the expected value in any of the cells of the 2 × 2 table is <5, the Fisher’s exact test (FET) is calculated instead of the chi-square value. The p value for the FET is calculated directly from the 2 × 2 table in this instance, rather than by using chisquare tables. For either the chi-square test or the FET, the p value indicates the level of certainty one has that the association between the variables is not occurring by chance alone. Both the chi-square test and the FET require that the variables be mutually exclusive and independent.

Univariate Analysis: Continuous Variables Continuous variables, such as age or severity of illness measurement, are compared among the case- and control-patients or noncases by using measures of central tendency, most frequently the mean or median. If the data are normally distributed (i.e., plotting the values on a graph yields a bell-shaped, or normal, curve), the mean and its standard deviation should be calculated. If the data are not normally distributed, the median and range of the data values should be used.

Stratified and Multiple Variable Analysis Because many HAI are multifactorial, often it is necessary to control for one or more variables while testing another. For instance, SSIs frequently are related to the surgeon’s skill (usually measured as the duration of surgery), the condition of the surgical site at the time of the operation (measured by a standard surgical site classification score), and the patient’s underlying health status (measured by a variety of risk factor scores).

Analytic techniques to control for all of these factors usually start with simple stratification of the data. Other techniques include logistic or linear regression models (for categorical and continuous outcome variables, respectively), which require advanced statistical software and training. In some outbreaks, the number of case-patients may be too small to do either stratified or regression analysis. Furthermore, two or more variables may be linearly
associated so that the independent importance of each risk factor cannot be determined. Details on the use of univariate, stratified, and multivariate statistical techniques can be found in Chapter 3.

Use of Microcomputers The analytic techniques described in this section can be accomplished with the use of microcomputers. Statistical software packages, such as Statistical Analysis System (SAS Institute Inc., Cary, NC), EpiInfo Software (Centers for Disease Control and Prevention [CDC], Atlanta, GA), and others, offer a wide variety of features. Particularly useful is the Statcalc feature of EpiInfo. It allows calculation of the necessary sample size to find significant associations; direct input of data into crosstabulation tables for calculation of ORs or RRs and their respective chi-square, FET, and p values; and direct input of data into a trend analysis model for continuous variables (37). Calculation of the power of the study or the sample size necessary to detect significant associations is essential before embarking on any outbreak investigation or epidemiologic study. Details on the use of microcomputers in hospital epidemiology can be found in Chapter 15.


MICROBIOLOGY LABORATORY ASPECTS OF THE INVESTIGATION

Once a potential outbreak has been identified, the microbiology laboratory should be notified immediately, so that all appropriate specimens and positive cultures can be saved. Because of the ubiquitous nature of microorganisms in the healthcare facility environment, typing of microorganisms thought to be related to an outbreak may be essential to determine if the infected patient is indeed part of the outbreak. The first line of typing of microorganisms is species identification. This is followed by biotyping and then antimicrobial susceptibility testing. For example, during an outbreak of SSIs caused by MRSA, a patient thought to be involved in the outbreak would be excluded as a casepatient if antimicrobial susceptibility testing revealed that he or she was infected with a methicillin-sensitive strain of S. aureus.

When antimicrobial susceptibility testing is insufficient to determine the relatedness of two microorganisms, other methods of typing can be used, including serotyping, phage typing, isoenzyme electrophoresis, and genetic fingerprinting techniques (e.g., pulsed-field gel electrophoresis, plasmid analysis, or restriction fragment polymorphism). These methods are further detailed in Chapter 94.

Although some research-oriented hospital laboratories may be capable of very sophisticated typing techniques, most infection control professionals require assistance in typing microorganisms from an outbreak. University, state health department, the CDC, or other laboratories may be able to assist with typing of isolates from an outbreak. It should be remembered that genetic or other typing of isolates can determine whether the isolates are the same strain (clonal) or not (nonclonal), but it cannot tell whether there is an outbreak or not. Outbreaks can be caused by clonal (common source) or nonclonal (intermittent person-to-person transmission because of inadequate hand hygiene) isolates.


ENVIRONMENTAL INVESTIGATION

A thorough investigation of an infectious disease/adverse event outbreak should include some inspection of the environment, particularly if an inanimate object is epidemiologically implicated as a possible means of transmission. For example, investigation of an outbreak of Serratia marcescens SSIs following breast reconstruction revealed that expandable breast implants were associated with a greater risk of infection than were nonexpandable implants. Furthermore, infections were more likely when the expansion procedure was performed in the surgeon’s office (38). This led the investigators to sample solutions, water sources, and personnel from the surgeon’s office that was involved in the expansion procedure. Positive cultures were obtained only from a specimen of saline taken from a partially used bag in the procedure room, allowing investigators to remove the contaminated solution and other bags with the same purchase date. Environmental cultures should not be taken randomly, because many surfaces are contaminated with numerous microorganisms, perhaps including the microorganism being investigated. Positive culture results from such random sampling may be misleading, difficult to interpret, and often confusing to investigators. Similarly, the first step in any outbreak investigation should not be widespread personnel or environmental culturing; rather such culturing should be based on the epidemiologic data identifying a potential source.

In addition to environmental cultures, outbreaks of diseases/adverse events caused by airborne microorganisms such as M. tuberculosis or Aspergillus spp. merit a thorough inspection of air-handling systems, isolation room airflow patterns, and infection control techniques. Again, neither routine environmental culturing nor selected culturing of the air or room is indicated; these should only be done when epidemiologically directed. Without epidemiologic direction, such culturing usually either misses the source or leads to uninterpretable results.


INTERPRETING RESULTS

The most important part of the investigation is the interpretation of results. Meaningful associations between exposures or risk factors and the development of disease depend on numerous factors: the quality of the study design and the study population, biologic plausibility (i.e., the measured association makes biologic sense), and the exposure’s preceding the onset of the disease/adverse event (39). Other qualities that lend confidence to a significant association are the statistical strength of the association, consistency with other studies, and the presence of a dose-response effect (39).


INSTITUTING CONTROL MEASURES

Control measures can be instituted as soon as a potential outbreak is discovered. For example, increased attention to hand hygiene and other infection control techniques may halt transmission. In addition, published guidelines from the CDC, Association for Professionals in Infection Control
and Epidemiology, the Society for Healthcare Epidemiology of America, Joint Commission, World Health Organization, or other organizations may lend guidance for specific situations (40, 41, 42, 43, 44, 45, 46, 47, 48, 49, 50, 51). If the investigation implicates a particular HCW or item of patient-care equipment, specific measures should be taken to rectify the situation.


EXAMPLE OF A HOSPITAL INVESTIGATION

An excellent example of an outbreak investigation in a hospital is the investigation of SSIs caused by an unusual human pathogen, Rhodococcus bronchialis, after openheart surgery (52). This outbreak provided an opportunity to assess risk factors for infection with R. bronchialis, mode of transmission of the microorganism, and potential sources for this unusual HAI pathogen. Logical hypotheses for the source of SSIs after open-heart surgery included preoperative (e.g., nurses, physicians, or wards), intraoperative (e.g., operating room environment or personnel), or postoperative (e.g., recovery room or intensive care unit personnel) exposures. The investigators analyzed both categorical and continuous variables as measures of potential risk for infection and possible exposures as the source of infection (Table 8-5). The only factor significantly associated with infection was the presence of one operating room nurse, nurse A, during the operative procedure. Examination of nurse A’s intraoperative practices revealed that she could have contaminated the sterile field after performing an activated clotting time (ACT) test that involved the use of a water bath for incubation of a tube of the patient’s
blood. A revised hypothesis was that nurse A contaminated the sterile operative field after performing the ACT test; this would account for all of the cases of R. bronchialis SSIs during the epidemic period.


TABLE 8-5 Categorical and Continuous Variables as Measures of Potential Risk for Infection


Potential Risk Factor


Case-Patients (n = 7) (%)


Controls (n = 28)


Odds Ratio


p Value


Categorical variables


Male sex


7 (100)


24 (86)


NC


.6


Underlying conditions


6 (86)


22 (79)


1.6


1.0


Diabetes


1 (14)


6 (21)


0.6


1.0


Obesity


3 (43)


4 (14)


4.5


.1


Smoking


4 (57)


9 (32)


2.8


.4


Cancer


1 (14)


0 (0)


NC


.2


Renal insufficiency


0 (0)


0 (0)


Treatment with steroids


1 (14)


1 (4)


4.5


.4


Chronic lung disease


2 (29)


3 (11)


3.3


.3


Presence of nurse A


7 (100)


6 (21)


NC


.0003


Coronary artery bypass graft


7 (100)


28 (100)


Saphenous vein


6 (86)


26 (93)


0.5


.5


Mammary artery


6 (86)


25 (89)


0.7


1.0


Transfusion


4 (57)


13 (46)


2.2


1.0


Continuous variables


Preoperative stay (d)


1.8 ± 1.3a


1.9 ± 1.8


.7


Postoperative stay (d)


6.2 ± 1.3


7.5 ± 3.7


.4


Age (year)


59.4 ± 5.4


58.5 ± 11.0


.9


Number of underlying conditions


2.2 ± 1.9


1.1 ± 0.9


.2


Duration of operation (min)


284 ± 64


292 ± 87


.9


Duration of bypass (min)


119 ± 38


128 ± 44


.7


Duration of aortic clamping (min)


67 ± 23


70 ± 27


.8


Amount of blood reperfused (mL)


903 ± 236


901 ± 317


1.0


Cardiac indexb


2.8 ± 0.6


3.0 ± 0.5


.6


Duration of treatment (d)


Stay in cardiac intensive care unit


2.2 ± 0.4


2.9 ± 2.2


.8


Swan-Ganz catheter


1.8 ± 0.4


2.2 ± 1.0


.6


Arterial line


2 ± 0


2.3 ± 1.0


.6


Mediastinal drains


2 ± 0


2.2 ± 0.8


.6


Pacer wires


4.8 ± 0.4


5.0 ± 1.6


.8


Ventilation


1 ± 0


1.6 ± 2.7


.6


Antimicrobial prophylaxis


4.2 ± 2.2


3.7 ± 1.0


.9


a Plus/minus values are means ± SD. ICU, intensive care unit; NC, not calculable.

b Cardiac index was defined as cardiac output in liters per minute per square meter of body surface area.


(From Richet HM, Craven PC, Brown JM, et al. A cluster of Rhodococcus (Gordona) bronchialis sternal wound infections after coronary artery bypass surgery. N Engl J Med 1991;324:104-109, with permission.)


To prove that nurse A was responsible for all of the cases of R. bronchialis SSIs at the hospital, the investigators performed numerous cultures indicated by the epidemiologic data. These included cultures of nurse A’s and nurse B’s hands before and after each performed the ACT test; nasal swabs from all cardiac operating room personnel; swabs from nurse A’s scalp, pharynx, vagina, and rectum; and swabs from environmental sites while nurse A was present in or absent from the operating room. Only cultures of nurse A’s hands after performing the ACT test, nurse A’s nasal swab, settle plates from the operating room while nurse A was present, and nurse A’s scalp and vaginal cultures were positive for R. bronchialis. To identify the ultimate source of the microorganism, nurse A’s operating room locker and her home were examined and selectively cultured. The neck-scruff skin of nurse A’s dog and air vents at her home (where the dog would lay) were positive for R. bronchialis. Antimicrobial susceptibility testing and molecular typing showed that all of the outbreak isolates (i.e., patient, HCW, environment, and dog) were identical and distinct from nonoutbreak stock strains of R. bronchialis.

The role of the water bath used to incubate blood samples for the ACT test was analyzed by simulating what the scrub nurses would do during surgery and by using a colorless fluorescent dye in the water bath. After simulating the beginning of an open-heart procedure (e.g., performing an ACT test and opening sterile packs for the procedure), 8/11 circulating nurses contaminated the sterile field with fluorescent dye from the water bath. Also contaminated with fluorescent dye were all of the nurses’ hands; some of the nurses’ wrists, forearms, and scrub suits; the outer surface of the water bath container; the table surface; and the floor around the water bath. This simulation showed that although the bath water was culture-negative for R. bronchialis, the bath water, by wetting the hands of nurse A, provided the mechanism for the microorganism to be spread from nurse A’s hands to the sterile field. Because nurse A was epidemiologically implicated in the investigation, cultures were obtained from a variety of sources highly likely to yield positive results. Random culturing of the operating room environment and other personnel earlier in the investigation would have been unfocused, increasing the work load on the laboratory without aiding the investigation, and most likely would have missed the source of the outbreak. Additional selected surgical personnel and environmental sources were included in the culture survey to avoid identification of nurse A as the probable source before confirming culture evidence could be obtained.


FINAL STEPS

After instituting control measures, assessing the efficacy of the introduced control measures is essential. Occasionally, more than one mode of transmission is present, and prevention interventions eliminate only one of the modes of transmission (53). In other situations, it is essential to ensure that previously accepted control measures really are adequate to terminate transmission (54,55).

Once an investigation is concluded, it is imperative that all of the concerned parties in the hospital and state or local health department, consultants, and other involved persons be told of the results of the investigation. In addition, if patient-care devices or products are implicated in the investigation, the appropriate divisions of the Food and Drug Administration or CDC should be alerted. Finally, during the course of the investigation, answering inquiries from the public and press may be necessary. It is good practice to have one person, usually from the public relations, risk management, or legal departments of the healthcare facility, respond to these inquiries. That person should be kept informed of all developments in the investigation.

Although the investigation of outbreaks is an interesting and challenging endeavor, it may be beyond the capability of a given infection control or epidemiology department because of financial or personnel resource constraints or lack of expertise in analytic and epidemiologic techniques. In such instances, assistance is available from state or local health departments, the CDC, university infection control or epidemiology departments, other facility infection control personnel, or private consultants.


RESULTS USING THIS APPROACH

From July 1987 through December 2005, the previously described approach to investigation of outbreaks was consistently applied by Epidemic Intelligence Service officers in the Investigation and Prevention Branch, Hospital Infections Program (currently the Prevention and Response Branch, Division of Healthcare Quality Promotion), CDC. In nearly 150 outbreak investigations, the source was identified and the outbreak was terminated (4,16, 17, 18, 20,21,22,25,27,29,33, 34, 35,38,54,55, 56, 57, 58, 59, 60, 61, 62, 63, 64, 65, 66, 67, 68, 69, 70, 71, 72, 73, 74, 75, 76, 77, 78, 79, 80, 81, 82, 83,84,85, 86, 87, 88, 89, 90, 91, 92, 93,94,95, 96, 97, 98, 99,100,101,102,103,104,105,106,107,108,109,110,111, 112, 113, 114, 115,116,117, 118, 119, 120, 121, 122, 123, 124, 125, 126, 127,128,129, 130, 131, 132, 133, 134, 135, 136, 137, 138, 139, 140,141,142,143, 144, 145, 146, 147, 148, 149, 150, 151, 152, 153, 154, 155, 156,157,158,159,160, 161, 162, 163, 164, 165, 166, 167,168,169, 170, 171, 172, 173, 174, 175, 176, 177, 178, 179, 180, 181, 182, 183, 184) (Table 8-6). The use of this approach has led to the identification of intrinsic product contamination [Yersinia enterocolitica from packed red blood cells (58), Pseudomonas cepacia in povidoneiodine disinfectant (71), aseptic peritonitis associated with peritoneal dialysis (132), gram-negative bloodstream infections associated with serum albumin (137), sepsis and death in neonates associated with contaminated glucose infusates (138), pyrogenic reactions associated with once daily administration of gentamicin (154), and Mycobacterium gordonae pseudoinfections traced to culture additive contamination (26)]. Many episodes of extrinsic product contamination involving either pyrogenic reactions and/or infection were detected that were associated with reprocessing of hemodialyzers (56,60,63,85,93,94,96, 103,110,111,118,128,139,159). New modes of transmission were identified, such as R. bronchialis SSIs or Malazessia furfur infections in neonates traced to the HCWs’ dogs (52,115); hepatitis A from prolonged excretion of the virus by premature neonates (70); many microorganisms from extrinsic contamination of the anesthetic propofol (20); anaphylactic reactions in patients and HCWs traced to latex exposure (21,84), aluminum, microcystin, or fluoride


toxicity in hemodialysis patients traced to an aluminum pump (94,103,128), inadequate water disinfection (128), or exhaustion of a reverse osmosis filter (103), respectively; Mycobacterium fortuitum infection or pseudoinfections from inadequate bronchoscopy disinfection (99); Nocardia SSIs traced to a colonized anesthesiologist and his contaminated home environment (102); bloodstream infections traced to needleless devices used in home infusion therapy (107,112,116,125, 126, 127); the role of the nursing shortage on increasing infection rates (106,120); and others. In addition, risk factors for transmission of M. tuberculosis (34,35,74,83,92) to patients and HCWs in healthcare settings were identified, and interventions were implemented and documented to terminate such transmission (54,55,98). Similarly, risk factors for the emergence and transmission of vancomycin-resistant enterococci were identified (104,105,122, 123, 124); then interventions (including active detection and isolation including active surveillance testing and barrier precautions) were implemented and shown to be effective in reducing or eradicating transmission on a ward (104,105), in an entire hospital (124), or in an entire region of a state (all acute care and long-term care facilities) (141). In addition, new and emerging HAI pathogens were identified, such as M. furfur in neonates (57,115), Y. enterocolitica in red blood cell products (58), P. (now Burkolderia) cepacia in cystic fibrosis patients (59,73), multidrug-resistant M. tuberculosis (4,25,34,35,54,55,74,83,92,95,98), nontuberculous mycobacteria in hemodialysis patients (60) or bronchoscopy patients (99), R. bronchialis or Norcardia farcinica in cardiac surgery patients (52,102), Enterobacter hormaechei in neonates (99), Akremonium kiliense in surgical patients (109), Ochrabactrum anthoropi in pediatric patients (114), vancomycin-resistant enterococci (104,105,122, 123, 124,141), and S. aureus with reduced susceptibility to vancomycin (142).

Only gold members can continue reading. Log In or Register to continue

Stay updated, free articles. Join our Telegram channel

Jun 22, 2016 | Posted by in GENERAL & FAMILY MEDICINE | Comments Off on Investigation of Outbreaks

Full access? Get Clinical Tree

Get Clinical Tree app for offline access