OBJECTIVES
After studying this chapter, you should be able to:
Describe the manner in which O2 flows “downhill” from the lungs to the tissues and CO2 flows “downhill” from the tissues to the lungs.
List the important factors affecting the affinity of hemoglobin for O2 and the physiologic significance of each.
List the reactions that increase the amount of CO2 in the blood, and draw the CO2 dissociation curve for arterial and venous blood.
Define alkalosis and acidosis and list typical causes and compensatory responses to each.
Define hypoxia and describe differences in subtypes of hypoxia.
Describe the effects of hypercapnia and hypocapnia, and give examples of conditions that can cause them.
INTRODUCTION
The concentrations for O2 and CO2 (measured as partial pressures, or Po2 and Pco2) change within each region of the lung, allowing for these gases to flow “downhill” or from higher partial pressures to lower partial pressures. For example, Po2 is highest in the alveoli upon inspiration and lowest in the deoxygenated blood, whereas, Pco2 is exactly opposite. This allows for O2 to cross the alveoli and re-oxygenate the blood in the pulmonary vasculature, while CO2 leaves the bloodstream and enters the alveoli where it is expired. However, the amount of both of these gases transported to and from the tissues would be grossly inadequate if it were not for the fact that about 99% of the O2 that dissolves in the blood combines with the O2-carrying protein hemoglobin and that about 94.5% of the CO2 that dissolves enters into a series of reversible chemical reactions that convert it into other compounds. Thus, the presence of hemoglobin increases the O2-carrying capacity of the blood 70-fold, and the reactions of CO2 increase the blood CO2 content 17-fold. In this chapter, physiologic details that underlie O2 and CO2 movement under various conditions are discussed.
OXYGEN TRANSPORT
Oxygen delivery, or by definition, the volume of oxygen delivered to the systemic vascular bed per minute, is the product of the cardiac output and the arterial oxygen concentration. The ability to deliver O2 in the body depends on both the respiratory and the cardiovascular systems. O2 delivery to a particular tissue depends on the amount of O2 entering the lungs, the adequacy of pulmonary gas exchange, the blood flow to the tissue, and the capacity of the blood to carry O2. Blood flow to an individual tissue depends on cardiac output and the degree of constriction of the vascular bed in the tissue. The amount of O2 in the blood is determined by the amount of dissolved O2, the amount of hemoglobin in the blood, and the affinity of the hemoglobin for O2.
The dynamics of the reaction of hemoglobin with O2 make it a particularly suitable O2 carrier. Hemoglobin is a protein made up of four subunits, each of which contains a heme moiety attached to a polypeptide chain. In normal adults, most of the hemoglobin molecules contain two α and two β chains. Heme (see Figure 31–7) is a porphyrin ring complex that includes one atom of ferrous iron. Each of the four iron atoms in hemoglobin can reversibly bind one O2 molecule. The iron stays in the ferrous state, so that the reaction is oxygenation (not oxidation). It has been customary to write the reaction of hemoglobin with O2 as Hb + O2 HbO2. Because it contains four deoxyhemoglobin (Hb) units, the hemoglobin molecule can also be represented as Hb4, and it actually reacts with four molecules of O2 to form Hb4O8.
The reaction is rapid, requiring less than 0.01 s. The deoxygenation of Hb4O8 is also very rapid.
The quaternary structure of hemoglobin determines its affinity for O2. In deoxyhemoglobin, the globin units are tightly bound in a tense (T) configuration, which reduces the affinity of the molecule for O2. When O2 is first bound, the bonds holding the globin units are released, producing a relaxed (R) configuration, which exposes more O2 binding sites. The net result is a 500-fold increase in O2 affinity. In tissues, these reactions are reversed, resulting in O2 release. The transition from one state to another has been calculated to occur about 108 times in the life of a red blood cell.
The oxygen-hemoglobin dissociation curve relates percentage saturation of the O2 carrying power of hemoglobin (abbreviated as SaO2) to the Po2 (Figure 35–1). This curve has a characteristic sigmoid shape due to the T–R configuration interconversion. Combination of the first heme in the Hb molecule with O2 increases the affinity of the second heme for O2, and oxygenation of the second increases the affinity of the third, and so on, so that the affinity of Hb for the fourth O2 molecule is many times that for the first. Especially note that small changes at low Po2 lead to large changes in SaO2.
FIGURE 35–1
Oxygen-hemoglobin dissociation curve. pH 7.40, temperature 38°C. Inset table relates the percentage of saturated hemoglobin (SaO2) to Po2 and dissolved O2. (Modified with permission from Comroe JH Jr, et al: The Lung: Clinical Physiology and Pulmonary Function Tests, 2nd ed. Year Book; 1962.)

When blood is equilibrated with 100% O2, the normal hemoglobin becomes 100% saturated. When fully saturated, each gram of normal hemoglobin contains 1.39 mL of O2. However, blood normally contains small quantities of inactive hemoglobin derivatives, and the measured value in vivo is thus slightly lower. Using the traditional estimate of saturated hemoglobin in vivo, 1.34 mL of O2, the hemoglobin concentration in normal blood is about 15 g/dL (14 g/dL in women and 16 g/dL in men). Therefore, 1 dL of blood contains 20.1 mL (1.34 mL × 15) of O2 bound to hemoglobin when the hemoglobin is 100% saturated. The amount of dissolved O2 is a linear function of the Po2 (0.003 mL/dL blood/mm Hg Po2).
In vivo, the hemoglobin in the blood at the ends of the pulmonary capillaries is about 97.5% saturated with O2 (Po2 = 100 mm Hg). Because of a slight admixture with venous blood that bypasses the pulmonary capillaries (ie, physiologic shunt), the hemoglobin in systemic arterial blood is only 97% saturated. The arterial blood therefore contains a total of about 19.8 mL of O2 per dL: 0.29 mL in solution and 19.5 mL bound to hemoglobin. In venous blood at rest, the hemoglobin is 75% saturated and the total O2 content is about 15.2 mL/dL: 0.12 mL in solution and 15.1 mL bound to hemoglobin. Thus, at rest the tissues remove about 4.6 mL of O2 from each deciliter of blood passing through them (Table 35–1); 0.17 mL of this total represents O2 that was in solution in the blood, and the remainder represents O2 that was liberated from hemoglobin. In this way, 250 mL of O2 per minute is transported from the blood to the tissues at rest.
| mL/dL of Blood Containing 15 g of Hemoglobin | ||||
|---|---|---|---|---|
| Arterial Blood (Po2 95 mm Hg; Pco2 40 mm Hg; Hb 97% Saturated) | Venous Blood (Po2 40 mm Hg; Pco2 46 mm Hg; Hb 75% Saturated) | |||
| Gas | Dissolved | Combined | Dissolved | Combined |
| O2 | 0.29 | 19.5 | 0.12 | 15.1 |
| CO2 | 2.62 | 46.4 | 2.98 | 49.7 |
| N2 | 0.98 | 0 | 0.98 | 0 |
Three important conditions affect the oxygen-hemoglobin dissociation curve: the pH, the temperature, and the concentration of 2,3-diphosphoglycerate (DPG; 2,3-DPG). A rise in temperature or a fall in pH shifts the curve to the right (Figure 35–2). When the curve is shifted in this direction, a higher Po2 is required for hemoglobin to bind a given amount of O2. Conversely, a fall in temperature or a rise in pH shifts the curve to the left, and a lower Po2 is required to bind a given amount of O2. A convenient index for comparison of such shifts is the P50, the Po2 at which hemoglobin is half saturated with O2. The higher the P50, the lower the affinity of hemoglobin for O2.
FIGURE 35–2
Effects of temperature and pH on the oxygen-hemoglobin dissociation curve. Both changes in temperature (left) and pH (right) can alter the affinity of hemoglobin for O2. Plasma pH can be estimated using the modified Henderson-Hasselbalch equation, as shown. (Modified with permission from Comroe JH Jr, et al: The Lung: Clinical Physiology and Pulmonary Function Tests, 2nd ed. Year Book; 1962.)
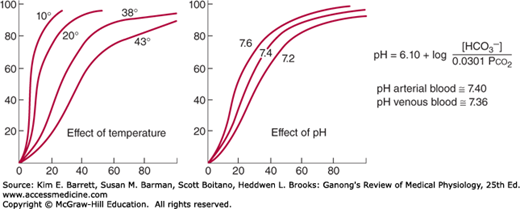
The decrease in O2 affinity of hemoglobin when the pH of blood falls is called the Bohr effect and is closely related to the fact that deoxygenated hemoglobin (deoxyhemoglobin) binds H+ more actively than does oxygenated hemoglobin (oxyhemoglobin). The pH of blood falls as its CO2 content increases, so that when the Pco2 rises, the curve shifts to the right and the P50 rises. Most of the unsaturation of hemoglobin that occurs in the tissues is secondary to the decline in the Po2, but an extra 1–2% unsaturation is due to the rise in Pco2 and consequent shift of the dissociation curve to the right.
2,3-DPG is very plentiful in red cells. It is formed from 3-phosphoglyceraldehyde, which is a product of glycolysis via the Embden-Meyerhof pathway. It is a highly charged anion that binds to the β chains of deoxyhemoglobin. One mole of deoxyhemoglobin binds 1 mol of 2,3-DPG. In effect,
In this equilibrium, an increase in the concentration of 2,3-DPG shifts the reaction to the right, causing more O2 to be liberated.
Because acidosis inhibits red cell glycolysis, the 2,3-DPG concentration falls when the pH is low. Conversely, thyroid hormones, growth hormones, and androgens can all increase the concentration of 2,3-DPG and the P50.
Exercise has been reported to produce an increase in 2,3-DPG within 60 min (although the rise may not occur in trained athletes). The P50 is also increased during exercise, because the temperature rises in active tissues and CO2 and metabolites accumulate, lowering the pH. In addition, much more O2 is removed from each unit of blood flowing through active tissues because the tissue Po2 declines. Finally, at low Po2 values, the oxygen-hemoglobin dissociation curve is steep, and large amounts of O2 are liberated per unit drop in Po2. Some clinical features of hemoglobin are discussed in Clinical Box 35–1.
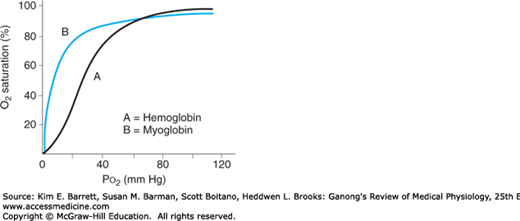
An interesting contrast to hemoglobin is myoglobin, an iron-containing pigment found in skeletal muscle. Myoglobin resembles hemoglobin but binds 1 rather than 4 mol of O2 per mole protein. The lack of cooperative binding is reflected in the myoglobin dissociation curve, a rectangular hyperbola rather than the sigmoid curve observed for hemoglobin (Figure 35–3). Additionally, the leftward shift of the myoglobin O2 binding curve when compared with hemoglobin demonstrates a higher affinity for O2, and thus promotes a favorable transfer of O2 from hemoglobin in the blood. The steepness of the myoglobin curve also shows that O2 is released only at low Po2 values (eg, during exercise). The myoglobin content is greatest in muscles specialized for sustained contraction. The muscle blood supply is compressed during such contractions, and myoglobin can continue to provide O2 under reduced blood flow and/or reduced Po2 in the blood.
FIGURE 35–3
Comparison of dissociation curves for hemoglobin and myoglobin. The myoglobin binding curve (B) lacks the sigmoidal shape of the hemoglobin binding curve (A) because of the single O2 binding site in each molecule. Myoglobin also has greater affinity for O2 than hemoglobin (curve shifted left) and thus can release O2 in muscle when Po2 in blood is low (eg, during exercise).
CLINICAL BOX 35–1 Hemoglobin & O2 Binding In Vivo Cyanosis
Reduced hemoglobin has a dark color, and a dusky bluish discoloration of the tissues, called cyanosis, appears when the reduced hemoglobin concentration of the blood in the capillaries is more than 5 g/dL. Its occurrence depends on the total amount of hemoglobin in the blood, the degree of hemoglobin unsaturation, and the state of the capillary circulation. Cyanosis is most easily seen in the nail beds and mucous membranes and in the earlobes, lips, and fingers, where the skin is thin. Although visible observation is indicative of cyanosis, it is not fully reliable. Further tests of arterial oxygen tension and saturation, blood and hemoglobin counts can provide more reliable diagnoses.
Effects of 2,3-DPG on Fetal & Stored BloodThe affinity of fetal hemoglobin (hemoglobin F) for O2, which is greater than that for adult hemoglobin (hemoglobin A), facilitates the movement of O2 from the mother to the fetus. The cause of this greater affinity is the poor binding of 2,3-DPG by the γ polypeptide chains that replace β chains in fetal hemoglobin. Some abnormal hemoglobins in adults have low P50 values, and the resulting high O2 affinity of the hemoglobin causes enough tissue hypoxia to stimulate increased red cell formation, with resulting polycythemia. It is interesting to speculate that these hemoglobins may not bind 2,3-DPG.
Red cell 2,3-DPG concentration is increased in anemia and in a variety of diseases in which there is chronic hypoxia. This facilitates the delivery of O2 to the tissues by raising the Po2 at which O2 is released in peripheral capillaries. In banked blood that is stored, the 2,3-DPG level falls and the ability of this blood to release O2 to the tissues is reduced. This decrease, which obviously limits the benefit of the blood if it is transfused into a hypoxic patient, is less if the blood is stored in citrate-phosphate-dextrose solution rather than the usual acid-citrate-dextrose solution.
THERAPEUTIC HIGHLIGHTSCyanosis is an indication of poorly oxygenated hemoglobin rather than a disease, and thus can have many causes, from cold exposure to drug overdose to chronic lung disease. As such, proper treatment depends on the underlying cause. For cyanosis caused by exposure to cold, maintaining a warm environment can be effective, whereas supplemental oxygen administration may be required under conditions of chronic disease.
CARBON DIOXIDE TRANSPORT
The solubility of CO2 in blood is about 20 times that of O2; therefore, considerably more CO2 than O2 is present in simple solution at equal partial pressures. The CO2 that diffuses into red blood cells is rapidly hydrated to H2CO3 because of the presence of carbonic anhydrase (Figure 35–4). The H2CO3 dissociates to H+ and HCO3−, and the H+ is buffered, primarily by hemoglobin, while the HCO3− enters the plasma. Some of the CO2 in the red cells reacts with the amino groups of hemoglobin and other proteins (R), forming carbamino compounds.
FIGURE 35–4
Fate of CO2 in the red blood cell. Upon entering the red blood cell, CO2 is rapidly hydrated to H2CO3 by carbonic anhydrase. H2CO3 is in equilibrium with H+ and its conjugate base, HCO3−. H+ can interact with deoxyhemoglobin, whereas HCO3− can be transported outside of the cell via anion exchanger 1 (AE1 or Band 3). In effect, for each CO2 molecule that enters the red cell, there is an additional HCO3− or Cl− in the cell.
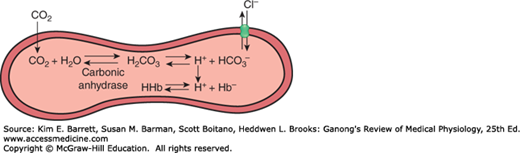
Because deoxyhemoglobin binds more H+ than oxyhemoglobin and forms carbamino compounds more readily, binding of O2 to hemoglobin reduces its affinity for CO2. The Haldane effect refers to the increased capacity of deoxygenated hemoglobin to bind and carry CO2. Consequently, venous blood carries more CO2 than arterial blood, CO2 uptake is facilitated in the tissues, and CO2 release is facilitated in the lungs. About 11% of the CO2 added to the blood in the systemic capillaries is carried to the lungs as carbamino-CO2.
Because the rise in the HCO3− content of red cells is much greater than that in plasma as the blood passes through the capillaries, about 70% of the HCO3− formed in the red cells enters the plasma. The excess HCO3− leaves the red cells in exchange for Cl− (Figure 35–4). This process is mediated by anion exchanger 1 (AE1; also called Band 3), a major membrane protein in the red blood cell. Because of this chloride shift, the Cl− content of the red cells in venous blood is significantly greater than that in arterial blood. The chloride shift occurs rapidly and is essentially complete within 1 s.
Note that for each CO2 molecule added to a red cell, there is an increase of one osmotically active particle in the cell—either an HCO3− or a Cl− (Figure 35–4). Consequently, the red cells take up water and increase in size. For this reason, plus the fact that a small amount of fluid in the arterial blood returns via the lymphatics rather than the veins, the hematocrit of venous blood is normally 3% greater than that of the arterial blood. In the lungs, the Cl− moves back out of the cells and they shrink.
For convenience, the various fates of CO2 in the plasma and red cells are summarized in Table 35–2. The extent to which they increase the capacity of the blood to carry CO2 is indicated by the difference between the lines indicating the dissolved CO2 and the total CO2 in the dissociation curves for CO2 shown in Figure 35–5.
| In plasma |
| 1. Dissolved |
| 2. Formation of carbamino compounds with plasma protein |
| 3. Hydration, H+ buffered, HCO3– in plasma |
| In red blood cells |
| 1. Dissolved |
| 2. Formation of carbamino-Hb |
| 3. Hydration, H+ buffered, 70% of HCO3– enters the plasma |
| 4. Cl– shifts into cells; mOsm in cells increases |
FIGURE 35–5
CO2 dissociation curves. The arterial point (a) and the venous point (v) indicate the total CO2 content found in arterial blood and venous blood of normal resting humans. Note the low amount of CO2 that is dissolved (orange trace) compared to that which can be carried by other means (Table 35–2). (Modified with permission from Schmidt RF, Thews G [editors]: Human Physiology. Springer; 1983.)

Of the approximately 49 mL of CO2 in each deciliter of arterial blood (Table 35–1), 2.6 mL is dissolved, 2.6 mL is in carbamino compounds, and 43.8 mL is in HCO3−. In the tissues, 3.7 mL of CO2
Stay updated, free articles. Join our Telegram channel

Full access? Get Clinical Tree


