We demand that big business give the people a square deal; in return we must insist that when any one engaged in big business honestly endeavors to do right he shall himself be given a square deal.
–President Theodore Roosevelt. From Autobiography.
CORPORATE ISSUES
This chapter does not present or discuss detailed financial aspects of running a company, how to improve a company’s financial performance, or detailed analyses of financial issues. Rather, this chapter identifies some of the important financial issues a company faces. This chapter is written for the neophyte in financial matters who is interested in an overall view of financial issues within a pharmaceutical company.
Comparing the Financial Status of Companies
Most well-run pharmaceutical companies frequently compare their financial results and condition with other companies of the industry as well as with composite values of the industry as a whole. The most common parameter measured is in terms of revenues. Revenues can be evaluated in several ways including total company sales, sales of the company’s individual pharmaceutical products, sales of products introduced within the past three or five years, or sales by therapeutic area. If pharmaceutical products are compared, one issue is whether over-the-counter drugs should be included. An important comparison is to compare the profit margins by the individual product lines.
In addition to comparing the company with its competition, it is also critical to compare its current performance with internally set goals as well as against its historical results. Current operating results should be then used to set new goals for the company to reach in the future.
Many important parameters may be used in addition to sales (Table 111.1), and many of these are used by most companies. Some are of particular importance for creating and/or achieving internal company goals.
Table 111.1Selected categories to use in comparing the financial status of pharmaceutical companies
1.
Pharmaceutical sales
2.
Pharmaceutical sales as a percentage of total sales
3.
Budget allocated to research and development
4.
Budget of research and development as a percentage of pharmaceutical sales
5.
Total sales
6.
Growth rate of sales over three years (or another time period)
7.
Total research and development budget as a percentage of total sales
8.
Net income
9.
Growth rate of net income over three years (or another time period)
Current assets divided by current liabilities (i.e., current ratio)b
19.
Long-term debt, other notes, and loans divided by shareholders’ equity (i.e., debt-to-equity ratio)c
20.
End-of-fiscal year common stock price divided by the earnings per share for that fiscal year (i.e., price-to-earnings ratio)d
21.
Units produced per payroll dollar
a This parameter is a measure of operational efficiency.
b This parameter is a measure of short-term solvency.
c This parameter is a measure of credit worthiness.
d This parameter is a measure of value for shareholders.
Financial Parameters that May Be Used as a Company’s Goal
Financial goals facilitate the evaluation of each time period (e.g., month, quarter, or year) and also serve as a motivator of staff. A company may use any specific measure or series of measures for this purpose. A few common measures are as follows:
Percentage (and actual amount) of growth in sales per year
Percentage (and actual amount) of return on sales per year
Percentage (and actual amount) of return on net assets
Percentage (and actual amount) of growth in earnings per share
Percentage (and actual amount) of growth in pretax profits
Once a series of measures to use is chosen, it is necessary to set specific quantitative goals for each of the measures chosen. This may be done as follows:
A minimum percentage of increase per year
An ideal percentage of increase per year
A range from the minimum to the ideal
A realistic target goal within the range
A target that tracks the industry average
The previous assessments are all internal company benchmarks except for the last one, which is an external benchmark. It is also important to compare the company to others in the industry. This can be done using any of the five measures listed previously or others. Some of the most important goals used are pretax profit per employee, sales per employee, and research and development spending as a percentage of sales. Others are shown in Table 111.1.
Joining Financial Policies to Corporate Objectives
A company’s corporate objectives, goals, and strategies include financial objectives, goals, and strategies. A company’s financial policies and procedures should reflect the operations of the company and report on those operations so the management of the company can evaluate those results in a timely manner in order to determine if the company is meeting its financial goals. Progress toward financial goals must be frequently monitored and reviewed. Procedures to conduct various corporate financial activities must be developed that are in concert with the company’s policies.
Accounting practices should reflect company operations within the limits of “generally accepted accounting principles,” and this may necessitate evaluating whether the present accounting practices need to be changed. Accounting procedures should be viewed as to their true purpose of providing management and the investment community with reliable timely financial information in order to make decisions. They are most useful in doing this when they are closely tied to actual business practice and are expressed in easily understood terms. The “numbers” are an aid in decision making and should be used as a tool and not as an oracle or as an end in itself.
Degree of Acceptable Financial Risk in Terms of Investing in High Return and High Development Risk Projects
The degree of financial investment risk in high return and high development risk projects that is acceptable to a company is a policy issue decided by the Chief Executive Officer in collaboration with the Chief Financial Officer (CFO) or the company’s Board of Directors. The degree of investment risk deemed acceptable varies widely among companies and usually within a company at different periods of its history.
There is a degree of risk assumed by undertaking a research and development (R and D) project or by not undertaking a detailed forecasting model. A company may break down its costs all the way to individual R and D projects or simply lump multiple projects into the generalized category of R and D.
Companies determine acceptable investment risk based on numerous factors, including:
Stability of the core business
Current rates of return on the company’s investments
Financial and other corporate goals
Degree of solvency
Degree of operating leverage (relationship of fixed to variable costs)
Personalities of the senior managers
Preferences of certain important outside groups (e.g., bankers, shareholders)
Opportunities available
The answer to the question of what is acceptable risk for a company influences many other business decisions made by the organization and reflects itself in the company’s reputation in the business community as relatively risk oriented or risk averse. Financial risk issues are even more complex within multinational companies, especially during periods of rapidly fluctuating currency exchange rates or periods of great threat to the company (e.g., major lawsuits, dry pipeline).
Financial Forecasts
How far into the future should a company attempt to extend its financial forecast and plans? The horizon in some businesses (e.g., dress designers) is short, and even a single year may be too long. In others, a 20-year cycle is necessary (e.g., forest products because of the life cycle of trees that are harvested). For drugs, a three- to seven-year time period is usually considered reasonable, given that the usual length of time required to develop and launch a new drug may be up to 15 years.
Some of the major parameters used to develop a financial forecast are sales forecasts, marketing expenses, R and D expenses, product pipeline, capital items, head count and the related personnel costs, and other general and administrative expenses. These categories are also accounted for at the end of each accounting period. Most companies perform certain analytical analyses at least on an annual basis. At that time, the previous year’s forecast is compared with the actual expenses incurred, and new forecasts are prepared. In addition, most companies compare spending and sales against budget on a monthly basis. Finally, all personnel, capital, and noncapital items from all company functions may be folded together to give an overall expense and capital investment picture of the short-term budget and long-term forecast.
Early discussion of potential or likely financial problems to be faced during the prospective three- to ten-year period is important. This discussion should allow senior management to take preventive steps to avoid problems and also to determine how tightly to control head count and other expenditures.
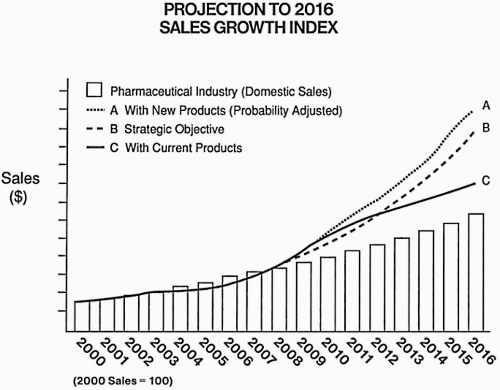
An ideal financial model considers all relevant inputs and gives the senior management as accurate a projection as possible of the company’s performance usually over the next three to ten years. The inputs into the financial model include those parameters listed in Table 111.2. Different outputs may be obtained from using this model (e.g., net present value, internal rate of return). The model may be used to evaluate different pricing strategies (see Chapter 98). Figure 111.1 shows how future sales can be projected using either current products or new expected products (both adjusted for likely terminations). If a company has a goal or objective, then that information may be illustrated for comparison as well as the expected mean industry growth.
Sources of Financing
There are three usual approaches to financing a company’s activities. These are to use internal, external, or a combination of financial sources. The overall degree to which each is used depends on many factors that are well known to financial professionals. Actual choices, however, are often based on personal recommendations of the Chief Executive Officer, usually with input of the CFO, to the Board of Directors with input from certain key outsiders (e.g., investors, stock analysts). Carefully developed criteria are sometimes used to establish the basis for reaching a decision. Even if this logical approach is followed, it will be necessary to adjust the criteria used to meet each specific situation. This is because conditions relating to the cost of capital frequently change, and there are specific situations for which certain criteria may not be appropriate. The question of whether to finance multiple businesses of a company separately or collectively generally depends on the company’s maturity, its existing operating results, and its objectives, as well as on the overall organization of those businesses.
Table 111.2Parameters evaluated for each product included in a financial analysis modela
1.
Sales forecast in units and money in constant dollars or another currency
2.
Anticipated increases in prices
3.
Promotional expenses
4.
Amount of sales lost to other company products (i.e., cannibalization)
5.
Probability of launch for investigational projects only
6.
Total costs to bring investigational projects to market
7.
Capital costs needed to produce the product
8.
Cost of goods sold
9.
Distribution costs
10.
Market research costs
11.
All other marketing costs
12.
Royalties and licensing fees
13.
Import duties
14.
Transfer prices
15.
Working capital (e.g., inventories, receivables, payables)
16.
Administrative costs
17.
Other costs
a Not all of these will be applicable for each project. Applicable parameters must be assessed for each year (e.g., one to 20 years) into the future for which a model will be used to forecast, together with historical data. In addition to data on each product and potential project, many external factors must be entered (e.g., tax rates, interest rates, inflation).
A novel method of financing drug development is being explored by some smaller pharmaceutical companies and biotech companies. This involves forming a partnership with a private equity firm to fund the development of their product(s) in exchange for allowing the investing firm to have the option to buy rights to those drugs as they approach or are launched on the market. It is too soon to know whether this will become a more common means of financing drug development. One advantage for the company is to minimize dilution of shareholder value in the company, at least in the short term, but it often can limit the upside potential should the drug prove to be successful. Other common methods of financing small pharmaceutical companies include private placements of equity in the company, typically from angel investors or venture capitalists, and research grants. Companies also raise needed capital from the traditional equity capital raising efforts of public offerings and by forming strategic license agreements with larger pharmaceutical companies.
Figure 111.1 Financial projection for a company over a number of years, with different assumptions shown. The bars represent the industry average.
Purposes of Budgets
Budgets are considered an essential device in almost every company, and they serve several functions.
Coordination. Budgets coordinate the activities of each group within a company or organization. They serve to focus all of the departments within a company toward the overall goals set by management by the allocation of capital and prevent a single group from conducting a much larger (or smaller) number or range of activities than desired.
Communication. Budgets communicate to managers (in a top-down manner) their authorized approved spending limits and communicate among groups within a company what financial results are expected to be achieved based on capital allocations. This helps others (e.g., service groups) plan their future activities. Budgets also communicate the needs of line managers to senior management in a bottom-up manner.
Benchmarks. Budgets provide one means to measure performance. Status on monthly progress can be shown easily in tables or figures.
Accountability. Managers who deviate from their budgets without acceptable reasons are usually held accountable for their actions.
Management tool. Managers who review performance versus budget find budgets useful to question what happened and why. This is an effective means of learning and guiding future plans and actions, as well as identifying problems for current management action.
Allocation of Resources
Corporate resources are allocated to various activities in a complex manner that differs greatly from company to company and from time to time within any company. Decision makers must decide how to allocate capital and other resources to capital equipment and facilities, acquisitions, spending on core businesses, and dividends to stockholders.
Future Needs and Resources
A closely related issue is that of forecasting the availability of future resources, especially capital resources. Standard financial techniques used to determine these numbers are available in financial textbooks. Monitoring previous forecasts within the company will indicate the degree of accuracy of methods used and ways in which methods were used. Ongoing monitoring of past resource allocations and utilizations, as shown in Fig. 111.2, is another integral part of being able to forecast future needs for resources. Ongoing monitoring is usually conducted within the overall corporation as well as within each subsidiary company business or division. It is also possible to conduct this activity at a department or even section level.
Research and Development’s Budget
Senior company managers must decide how much risk they are willing to take when they approve the R and D budget. Regardless of a company’s current financial performance, rationales are readily available and are used to justify spending more, less, or the same amount of money on R and D in the future. This is discussed later in this chapter. The amount of risk that the top R and D managers are willing to undertake and their plans for both the human capital and the capital requirements in the budget request should be clearly defined, as should their expected objectives and criteria for stating the degree to which they expect to achieve these objectives. Nonscientists should never accept comments along the lines of “This is too technical to explain to this group,” or “The scientific reasons are too complex to simplify.” Senior managers were hopefully chosen for their intelligence, ability to understand clearly articulated principles, and willingness to analytically determine whether the rewards are justified by the level of risk associated with a project. These nonscientists may request or hire other scientists or consultants to evaluate any detailed scientific hypotheses, concepts, or rationales.
Figure 111.2 Figure illustrates the staff assigned to a select group of projects (i.e., first quartile) for a specific period. Similar graphs may illustrate other time periods, other portions of the portfolio, or other departments.
Senior company managers should also assure themselves that there is an appropriate balance among resources allocated to drug discovery, drug development, and market support. Without an appropriate balance (which will likely change over the years) for the entire company, it is easy for a company to stray in the wrong direction. This is a major pitfall to avoid.
Psychological Aspects of Spending Money on Questionable Projects
Many companies face the question of deciding whether to spend additional money on a project about which serious questions have arisen after a moderate or large amount of money has already been spent. This important issue appears to arise quite often at all levels of decision making. Arkes and Blumer (1985) investigated this phenomenon, and they reported that there is a greater tendency to continue work and spend money on a highly questionable endeavor after some money and effort have been expended and invested. More importantly, they observed that the chances of success of the undertaking are inflated by those who have incurred the sunk cost as opposed to those who have not.
Projects and other activities develop momentum once they are initiated and, after a period of time, take on a life of their own. Therefore, it takes more courage for managers to question and stop a project after it is initiated than before it is begun. There is also a strong theoretical basis to the fact that people are often willing to “throw good money after bad.” This is why one frequently reads statements such as, “To terminate a project in which $1.1 billion has been invested represents an unconscionable mishandling of taxpayers’ dollars” [Senator Denton, November 4, 1981, quoted by Arkes and Blumer (1985)].
Some R and D executives require virtually 100% certainty that a project has no potential to succeed before they are willing to terminate it. This means that they will be investing money when the chance is over 90% that success will not be achieved. Other executives are willing to terminate a project at an earlier stage and place resources on other projects with a higher likelihood of success. The difference in behavior between two such executives could be viewed as one company moving ahead in a series of competitive races with one or more albatrosses around its neck. If one assumes that each company began a race with approximately equal resources (which is rarely true), then the company who sheds albatrosses or does not acquire any has a better chance of winning an important race against the competitors. Statistical grids can be used that provide industry-wide probabilities on projects that fail to meet certain milestone events to help an R and D executive determine whether or not a project should continue to be funded.
Only gold members can continue reading. Log In or Register to continue