Abbreviations and Acronyms
| Ab | Antibody |
| Abn | Abnormal |
| AFB | Acid-fast bacillus |
| Ag | Antigen |
| AIDS | Acquired immunodeficiency syndrome |
| ALT | Alanine aminotransferase |
| ANA | Antinuclear antibody |
| AST | Aspartate aminotransferase |
| CBC | Complete blood cell count |
| CF | Complement fixation |
| CHF | Congestive heart failure |
| CIE | Counterimmunoelectrophoresis |
| CK | Creatine kinase |
| CNS | Central nervous system |
| CSF | Cerebrospinal fluid |
| CXR | Chest x-ray |
| CYP | Cytochrome P450 |
| Diff | Differential cell count |
| EDTA | Ethylenediaminetetraacetic acid (edetate) |
| ELISA | Enzyme-linked immunosorbent assay |
| GI | Gastrointestinal |
| GNR | Gram-negative rod |
| GNCB | Gram-negative coccobacillus |
| GPC | Gram-positive coccus |
| GVCB | Gram-variable coccobacillus |
| HLA | Human leukocyte antigen |
| Ig | Immunoglobulin |
| IM | Intramuscular(ly) |
| INR | International Normalized Ratio |
| IV | Intravenous(ly) |
| Min | Minute |
| MN | Mononuclear cell |
| MRI | Magnetic resonance imaging |
| N | Normal |
| Neg | Negative |
| NPO | Nothing by mouth (nil per os) |
| PCR | Polymerase chain reaction |
| PMN | Polymorphonuclear neutrophil (leukocyte) |
| PO | Orally (per os) |
| Pos | Positive |
| PTH | Parathyroid hormone |
| RBC | Red blood cell |
| RPR | Rapid plasma reagin (syphilis test) |
| SIADH | Syndrome of inappropriate antidiuretic hormone (secretion) |
| SLE | Systemic lupus erythematosus |
| T3 | Triiodothyronine |
| T4 | Tetraiodothyronine (thyroxine) |
| TSH | Thyroid-stimulating hormone |
| V | Variable |
| VDRL | Venereal Disease Research Laboratory (syphilis test) |
| WBC | White blood cell |
| Wk | Week |
| Yr | Year |
| ↑ | Increased |
| ↓ | Decreased |
| ↔ | No change |
Basic Electrocardiography
This chapter includes criteria for the diagnosis of basic electrocardiographic waveforms and cardiac arrhythmias. It is intended for use as a reference and assumes a basic understanding of the electrocardiogram (ECG).
Electrocardiographic interpretation is a “stepwise” procedure, and the first steps are to study and characterize the cardiac rhythm.
Categorize what you see in the 12-lead ECG or rhythm strip, using the three major parameters that allow for systematic analysis and subsequent diagnosis of the rhythm:
Mean rate of the QRS complexes (slow, normal, or fast).
Width of the QRS complexes (wide or narrow).
Rhythmicity of the QRS complexes (characterization of spaces between QRS complexes) (regular or irregular).
Step 2 consists of examining and characterizing the morphology of the cardiac waveforms.
Examine for atrial abnormalities and bundle branch blocks (BBBs) (See Bundle Branch Block).
Assess the QRS axis and the causes of axis deviations (See The Mean QRS Axis in the Frontal Plane (Limb Leads)).
Examine for signs of left ventricular hypertrophy (See Left Ventricular Hypertrophy).
Examine for signs of right ventricular hypertrophy (See Right Ventricular Hypertrophy (RVH)).
Examine for signs of myocardial infarction, if present (See Myocardial Injury, Ischemia, and Infarction).
Bear in mind conditions that may alter the ability of the ECG to diagnose a myocardial infarction (See Test Performance Characteristics for Electrocardiographic Criteria in the Diagnosis of Myocardial Infarction).
Examine for abnormalities of the ST segment or T wave (See Tables 7–6, Table 7–7, Table 7–8, and Table 7–9).
Assess the QT interval (See Prolonged QT Interval).
Examine for miscellaneous conditions (See Miscellaneous Abnormalities).
*Adapted, with permission, from Evans GT Jr.: ECG Interpretation Cribsheets, 4th ed. Ring Mountain Press, 1999.
Step One: Diagnosis of the Cardiac Rhythm
Most electrocardiograph machines display 10 seconds of data in a standard tracing. A rhythm is defined as three or more successive P waves or QRS complexes.
Categorize the patterns seen in the tracing according to a systematic method. This method proceeds in three steps that lead to a diagnosis based on the most likely rhythm producing a particular pattern:
What is the mean rate of the QRS complexes?
Slow (<60 bpm): The easiest way to determine this is to count the total number of QRS complexes in a 10-second period. If there are no more than 9, the rate is slow.
Another method for determining the rate is to count the number of large boxes (0.20 s) between QRS complexes and use the following formula:
Rate = 300 ÷ (number of large boxes between QRS complexes)
A slow heart rate (<60 bpm) has more than five large boxes between QRS complexes.
Normal (60–100 bpm): If there are 10–16 complexes in a 10-second period, the rate is normal.
In normal heart rates, the QRS complexes are separated by three–five large boxes.
Fast (>100 bpm): If there are ≥ 17 complexes in a 10-second period, the rate is fast.
Fast heart rates have fewer than three large boxes between QRS complexes.
Is the duration of the dominant QRS morphology narrow (<0.12 s) or wide (≥ 0.12 s)? (Refer to the section on the QRS duration.)
What is the “rhythmicity” of the QRS complexes (defined as the spacing between QRS complexes)? Regular or irregular? (Any change in the spacing of the R-R intervals defines an irregular rhythm.)
Using the categorization above, refer to Tables 7–1 and 7–2 to select a specific diagnosis for the cardiac rhythm.
| Rate | Fast | Normal | Slow |
|---|---|---|---|
| Narrow QRS duration | Sinus tachycardia Atrial tachycardia Atrial flutter (2:1 AV conduction) Junctional tachycardia Orthodromic AVRT | Sinus rhythm Ectopic atrial rhythm Atrial flutter (4:1 conduction) Accelerated junctional rhythm | Sinus bradycardia Ectopic atrial bradycardia Junctional rhythm |
| Wide QRS duration | All rhythms listed above under narrow QRS duration, but with BBB or IVCD patterns | ||
Ventricular tachycardia Antidromic AVRT | Accelerated ventricular rhythm | Ventricular escape rhythm | |
| Rate | Fast | Normal | Slow |
|---|---|---|---|
| Narrow QRS duration | Atrial fibrillation Atrial flutter (variable AV conduction) Multifocal atrial tachycardia Atrial tachycardia with AV block (rare) | Atrial fibrillation Atrial flutter (variable AV conduction) Multiform atrial rhythm Atrial tachycardia with AV block (rare) | Atrial fibrillation Atrial flutter (variable AV conduction) Multiform atrial rhythm Sinus rhythm with 2° AV block |
| Wide QRS duration | All rhythms listed above under narrow QRS duration, but with BBB or IVCD patterns | ||
| Torsade de pointes Rarely, anterograde conduction of atrial fibrillation over an accessory pathway in patients with WPW syndrome | |||
The sinus node is the primary pacemaker for the heart. Because the sinus node is located at the junction of the superior vena cava and the right atrium, in sinus rhythm the atria are activated from “right to left” and “high to low.” The P wave in sinus rhythm is upright in lead II and inverted in lead aVR. In lead VI, the P wave is usually biphasic with a small initial positive deflection due to right atrial activation and a terminal negative deflection due to left atrial activation.
The normal sinus rate is usually between 60 and 100 bpm but can vary significantly. During sleep, when parasympathetic tone is high, sinus bradycardia (sinus rates <60 bpm) is a normal finding, and during conditions associated with increased sympathetic tone (exercise, stress), sinus tachycardia (sinus rates >100 bpm) is common. In children and young adults, sinus arrhythmia (sinus rates that vary by more than 10% during 10 seconds) due to respiration is frequently observed.
In some situations, the atria are activated by an ectopic atrial focus rather than the sinus node. In this case, the P wave will have an abnormal shape depending on where the ectopic focus is located. For example, if the focus arises from the left atrium, the P wave is inverted in leads I and aVL. If the depolarization rate of the ectopic focus is between 60 and 100 bpm, the patient has an ectopic atrial rhythm. If the rate is <60 bpm, the rhythm is defined as an ectopic atrial bradycardia.
In atrial flutter, the atria are activated rapidly (usually 300 bpm) owing to a stable reentrant circuit. Most commonly, the reentrant circuit rotates counterclockwise around the tricuspid valve. Because the left atrium and interatrial septum are activated low-to-high, “sawtooth” flutter waves that are inverted in the inferior leads (II, III, and aVF) are usually observed. If every fourth atrial beat is conducted to the ventricles (owing to slow conduction in the atrioventricular [AV] node), a relatively normal ventricular rate of 75 bpm is observed.
It is common to have isolated premature QRS activity that leads to mild irregularity of the heart rhythm. A premature narrow QRS complex is most often due to a normally conducted premature atrial complex (PAC) or more rarely a premature junctional complex (PJC). A premature wide QRS complex is usually due to a premature ventricular complex (PVC) or to a premature supraventricular complex (PAC or PJC) that conducts to the ventricle with aberrant conduction due to block in one of the bundle branches (See Bundle Branch Block). Premature supraventricular complexes (with or without aberrant conduction) are commonly observed phenomena that are not associated with cardiac disease. Although PVCs are observed in normal individuals, they are usually associated with higher risk in patients with cardiac disease.
Tachycardias are normally classified by whether the QRS complex is narrow or wide and whether the rhythm is regular or irregular. A narrow QRS tachycardia indicates normal activation of the ventricular tissue regardless of the tachycardia mechanism. Narrow QRS tachycardias are frequently grouped together as supraventricular tachycardia (SVT) and can be due to a number of mechanisms described in the following text. This grouping also has clinical usefulness because SVTs are not usually life-threatening. In addition to QRS width, it is useful to consider the anatomic site from which the tachycardia arises: atrium, atrioventricular junction, ventricle, or utilization of an accessory pathway (Figure 7–1).
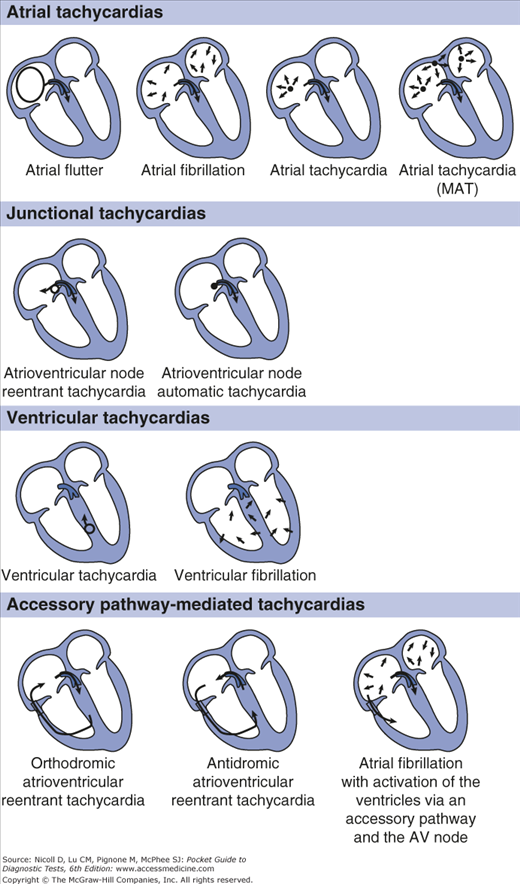
Sinus Tachycardia: Under many physiologic conditions, the sinus node discharges at a rate >100 bpm. In sinus tachycardia, an upright P wave can be observed in II and aVF and an inverted P wave is observed in aVR. The PR interval is usually relatively normal, because conditions associated with sinus tachycardia (most commonly sympathetic activation) also cause more rapid AV conduction.
Atrial Tachycardia: Rarely, a single atrial site other than the sinus node fires rapidly. This leads to an abnormally shaped P wave. The specific shape of the P wave depends on the specific site of atrial tachycardia. The PR interval depends on how quickly atrioventricular conduction occurs. As the atrial tachycardia rate increases, the AV node conduction slows (decremental conduction) and the PR interval increases; decremental conduction properties of the AV node prevent rapid ventricular rates in the presence of rapid atrial rates.
Atrial Flutter: The mechanism for atrial flutter is described above. Most commonly atrioventricular conduction occurs with every other flutter wave (2:1 conduction), leading to a heart rate of approximately 150 bpm. In some situations, very rapid ventricular rates can be observed due to 1:1 conduction, or slower rates observed due to 3:1 conduction.
Junctional Tachycardia: The most common type of tachycardia to arise from tissue near the atrioventricular junction is AV nodal reentrant tachycardia (AVNRT). In AVNRT, two separate parallel pathways of conduction are present within junctional and perijunctional tissue. Usually, one of the pathways has relatively rapid conduction properties but a long refractory period (“fast pathway”), and the other has slow conduction and a short refractory period (“slow pathway”). In some cases, a premature atrial contraction can block one of the pathways (usually the fast pathway), conduct down the slow pathway, and activate the fast pathway retrogradely, initiating a reentrant circuit. In rare circumstances, a site within the AV node fires rapidly as a result of increased automaticity.
Regardless of the mechanism, because the tachycardia originates within the AV junction, the atria and ventricles are activated simultaneously. Most commonly (in approximately 50% of cases), the P wave is buried in the QRS complex and is not seen. In approximately 40% of cases, the retrograde P wave is observed in the terminal portion of the QRS complex. The easiest place to see the retrograde P wave is in lead V1, where a low-amplitude terminal positive deflection (pseudo-R′ wave) is seen (Figure 7–2). In addition, a terminal negative deflection (pseudo-S wave) is seen in the inferior leads (II, III, and aVF). Finally, in about 10% of cases, the P wave is observed in the initial portion of the QRS complex. The location of the P wave depends on the relative speeds of retrograde activation of the atria and anterograde activation of the ventricles via the His-Purkinje system.
Accessory Pathway–Mediated Tachycardia: Usually, the AV node and His bundle provide the only path for AV conduction. In approximately 1 in 1000 individuals, an additional AV connection called an accessory pathway is present. The presence of two parallel pathways (the accessory pathway and the AV node-His bundle) for AV conduction increases the likelihood that reentrant tachycardia will occur. The most common tachycardia is a reentrant narrow QRS tachycardia in which the ventricles are activated via the His-Purkinje system and the atria are activated via retrograde activation from the accessory pathway (Figure 7–3). This type of tachycardia is frequently called orthodromic atrioventricular reentrant tachycardia (AVRT) because conduction through the AV node and His-Purkinje fibers occurs normally (ortho is Greek for straight or normal). Orthodromic AVRT is one cause of SVT; the QRS complexes are narrow and normal-appearing because the ventricles are activated via the AV node and His-Purkinje system, ventricular tissue, an accessory pathway, and atrial tissue. Because the ventricles and atria are activated sequentially, the P wave is most often observed within the ST segment (Figure 7–2). As discussed later, accessory pathways can also be associated with regular and irregular wide complex tachycardias.
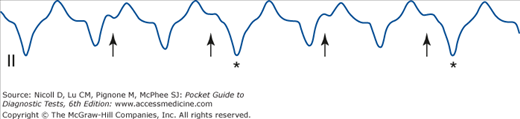
Figure 7–2.
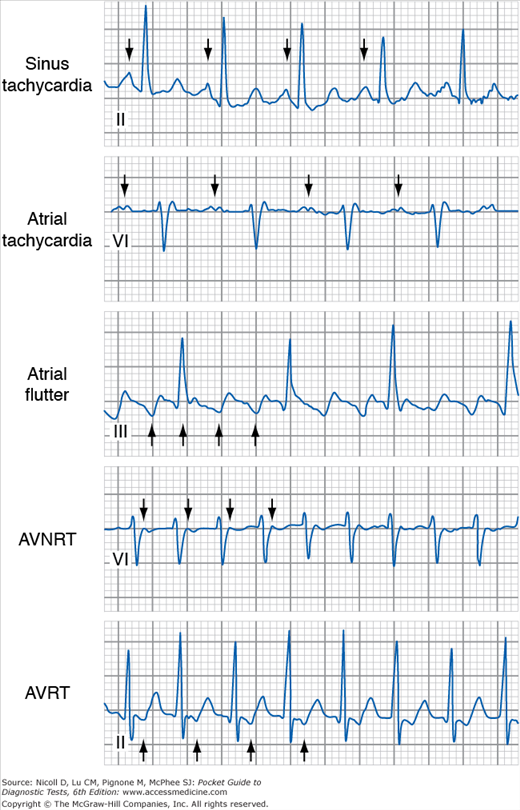
ECG appearance of different forms of regular SVTs. Arrows show the first four atrial deflections in each SVT. In sinus tachycardia, the P wave has a normal morphology, and the PR interval is normal. In atrial tachycardia, the P wave is abnormal (positive in V1, and the PR interval is prolonged because of decremental conduction in the AV node). In atrial flutter, inverted “saw-tooth” waves are observed in lead III. In AVNRT, a pseudo-R wave due to retrograde atrial activation is observed in lead V1. In AVRT, a retrograde P wave is observed in the ST segment because the atria and ventricles are activated sequentially. The P wave is usually located relatively close to the preceding QRS complex because the accessory pathway conducts rapidly.
Figure 7–3.
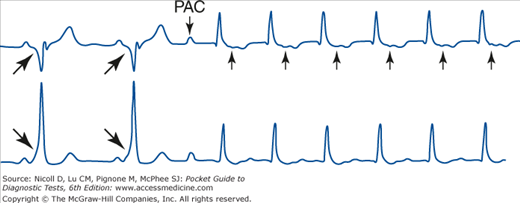
Initiation of SVT in a patient with an accessory pathway. During sinus rhythm, the ventricles are activated via the accessory pathway and the AV node-His bundle. Because the accessory pathway conducts rapidly and inserts into regular ventricular myocardium, the PR interval is short and a delta wave is observed (large arrows). A premature atrial complex (PAC) blocks in the accessory pathway and travels only down the AV node-His bundle, leading to a narrow QRS complex. The atria are activated retrogradely by the accessory pathway (small arrows), and orthodromic AVRT is initiated. (Adapted from Kusumoto FM: Cardiovascular disorders: Heart disease. In: Pathophysiology of Disease: An Introduction to Clinical Medicine, 6th ed. McPhee SJ, Hammer G [editors], McGraw-Hill, 2010.)
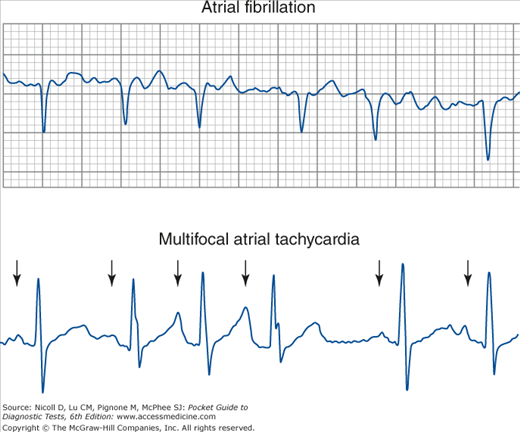
Atrial Fibrillation: Atrial fibrillation is the most common abnormal fast heart rhythm observed. Atrial fibrillation is most commonly due to multiple chaotic wandering wavelets of reentry that cause irregular activation of the atria. Because the AV node is also activated irregularly, AV conduction is variable and an irregular ventricular rhythm is observed. In atrial fibrillation, the rhythm is often called “irregularly irregular” because there is no organized atrial activity. On the ECG, continuous fibrillatory low-amplitude waves with varying morphology are observed with no easily identifiable isoelectric period. The fibrillatory waves are usually best seen in leads V1, V2, II, III, and aVF.
Multifocal Atrial Tachycardia: In multifocal atrial tachycardia (often called MAT), several atrial sites beat due to abnormal automaticity. This leads to P waves of three or more different morphologies. The rhythm is usually irregular; the different sites fire at different rates. MAT can be distinguished from atrial fibrillation by discrete P waves and isoelectric periods between the T wave and the P wave. The most common cause of MAT is chronic obstructive pulmonary disease (approximately 60% of cases).
Atrial Flutter With Variable Block: Atrial flutter can sometimes present as an irregular rhythm because of variable AV block. In this case, although the ventricular rhythm is irregular, there are often relatively constant intervals between the QRS complexes. For example, if the atrial flutter rate is 300 bpm, the possible ventricular rates will be 300 bpm, 150 bpm, 100 bpm, or 75 bpm for 1:1, 2:1, 3:1, and 4:1 AV conduction, respectively.
The most common cause of wide QRS complex tachycardia with a regular rhythm (WCT-RR) is sinus tachycardia with either right bundle branch block (RBBB) or left bundle branch block (LBBB). However, if a patient with structural heart disease presents with WCT-RR, one assumes a worst-case scenario and the presumptive diagnosis becomes ventricular tachycardia (VT). Most commonly, VT originates from a rapid reentrant circuit located at the border of infarcted and normal myocardium. Because the ventricles are not activated via the bundle branches or the Purkinje system, an abnormally wide QRS complex is observed. Any atrial or junctional tachycardias associated with aberrant conduction can also cause a WCT-RR. Finally, in very rare circumstances, patients with accessory pathways present with antidromic AVRT in which the ventricles are activated via the accessory pathway (leading to a wide and bizarre QRS complex) and the atria are activated retrogradely via the His bundle-AV node (anti is Greek for against).
The ECG differentiation between regular SVTs with aberrant conduction (sinus tachycardia, atrial tachycardia, atrial flutter, junctional tachycardia, orthodromic AVRT) and VT can sometimes be difficult. Accurate diagnosis of VT is critical because this rhythm is frequently life-threatening. The two principal techniques for identifying VT are the presence of AV dissociation and abnormal QRS morphology.
Atrioventricular Dissociation: In AV dissociation, the atria and ventricles are not related in one-to-one fashion. AV dissociation can be due to several conditions:
Atrioventricular conduction block (See AV Block).
Slowing of the primary pacemaker, most commonly due to sinus bradycardia or sinus pauses with junctional escape rhythm (See Sinus Node Dysfunction).
Acceleration of a subsidiary pacemaker, most commonly due to VT or much less commonly due to junctional tachycardia.
The most important reason to identify AV dissociation is in wide complex tachycardia for the differentiation of SVT with aberrancy from VT. In VT, the rapid ventricular rate is often associated with retrograde block within the His-Purkinje system (ventriculoatrial block). This leads to P waves (from sinus node depolarization) that are not associated in 1:1 fashion with the QRS complexes (Figure 7–5). The presence of AV dissociation makes VT the most likely diagnosis in a patient with a regular wide complex tachycardia. In some circumstances, AV dissociation can be identified by the presence of capture beats or fusion beats. Occasionally, a properly timed P wave conducts to the ventricles and a portion (fusion beat) or all (capture beat) of ventricular tissue is activated by the His-Purkinje tissue for one QRS complex. It is always easier to identify AV dissociation rather than AV association; T waves can often be confused with P waves. Always examine the entire ECG for unexpected deflections in the QRS complex, ST segment, and T waves that are dissociated P waves. The P waves are usually most obvious in the inferior leads (II, III, and aVF) or V1.
Morphology Algorithms for Identifying VT
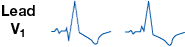
This method derives from an analysis of typical waveforms of RBBB or LBBB as seen in leads I, V1, and V2. If the waveforms do not conform to either the common or uncommon typical morphologic patterns, the diagnosis defaults to VT.
Determine the morphologic classification of the wide QRS complexes (RB type or LB type), using the criteria below.
Determination of the Morphologic Type of Wide QRS Complexes: Use lead V1 only to determine the type of bundle branch block morphology of abnormally wide QRS complexes.
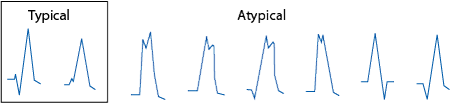
RBBB- and RBB-type QRS complexes as seen in lead V1: A wide QRS complex with a net positive area under the QRS curve is called the right bundle branch “type” of QRS. This does not mean that the QRS conforms exactly to the morphologic criteria for RBBB. Typical morphologies seen in RBBB are shown in the box at left below. Atypical morphologies at the right are most commonly seen in PVCs or during VT.
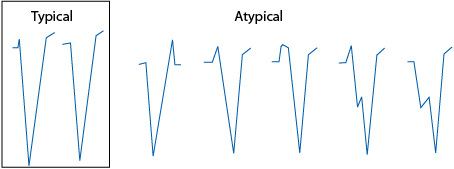
LBBB- and LBB-type QRS complexes as seen in lead V1: A wide QRS complex with a net negative area under the QRS curve is called a left bundle branch “type” of QRS. This does not mean that the QRS conforms exactly to the morphologic criteria for LBBB. Typical morphologies of LBBB are shown in the box at left below. Atypical morphologies at the right are most commonly seen in PVCs or during VT.
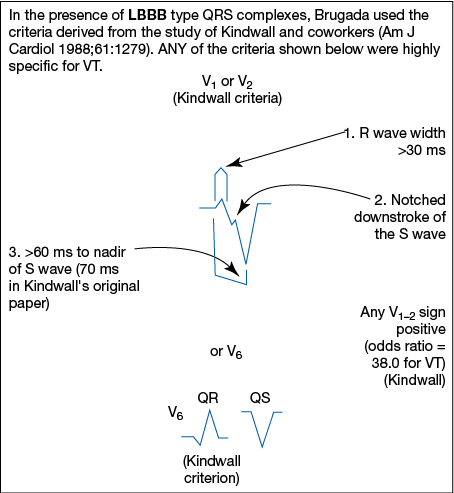
Apply criteria for common and uncommon normal forms of either RBBB or LBBB, as described below. The waveforms may not be identical, but the morphologic descriptions must match. If the QRS complexes do not match, the rhythm is probably VT.
RBBB: Lead I must have a terminal broad S wave, but the R/S ratio may be <1.
In lead V1, the QRS complex is usually triphasic but sometimes is notched and monophasic. The latter must have notching on the ascending limb of the R wave, usually at the lower left.
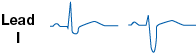
LBBB: Lead I must have a monophasic, usually notched R wave and may not have Q waves or S waves.

Both lead V1 and lead V2 must have a dominant S wave, usually with a small, narrow R wave. S descent must be rapid and smooth, without notching.
(Requires all six precordial leads.)
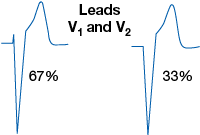
Brugada and coworkers reported on a total of 554 patients with WCTRR whose mechanism was diagnosed in the electrophysiology laboratory. Patients included 384 (69%) with VT and 170 (31%) with SVT with aberrant ventricular conduction.
Is there absence of an RS complex in ALL precordial leads?
If Yes (n = 83), VT is established diagnosis (sensitivity 21%, specificity 100%). Note: Only QR, Qr, qR, QS, QRS, monophasic R, or rSR′ are present. qRs complexes were not mentioned in the Brugada study.
If No (n = 471), proceed to next step.
Is the RS interval >100 ms in ANY ONE precordial lead?
If Yes (n = 175), VT is established diagnosis (sensitivity 66%, specificity 98%). Note: The onset of R to the nadir of S is >100 ms (>2.5 small boxes) in a lead with an RS complex.
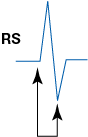
If No (n = 296), proceed to next step.
Is there AV dissociation?
If Yes (n = 59), VT is established diagnosis (sensitivity 82%, specificity 98%). Note: AV block also implies the same diagnosis.
If No (n = 237), proceed to next step. Note: Antiarrhythmic drugs were withheld from patients in this study. Clinically, drugs that prolong the QRS duration may give a false-positive sign of VT using this criterion.
Are morphologic criteria for VT present?
If Yes (n = 59), VT is established diagnosis (sensitivity 99%, specificity 97%). Note: RBBB type QRS in V1 versus LBBB type QRS in V1 should be assessed as shown in the boxes below.
If No (n = 169)—and if there are no matches for VT in the boxes below—the diagnosis is SVT with aberration (sensitivity 97%, specificity 99%).
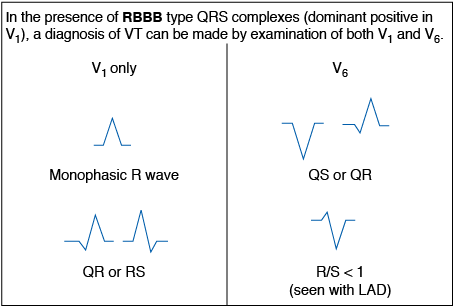
This method derives from an analysis of typical waveforms of RBBB or LBBB as seen in both leads V1 and V6. If the waveforms do not conform to the typical morphologic patterns, the diagnosis defaults to VT.
Determine the morphologic classification of the wide QRS complexes (RB type or LB type), using the criteria above.
Apply criteria for normal forms of either RBBB or LBBB, as described below. A negative answer to any of the three questions is inconsistent with either RBBB or LBBB, and the diagnosis defaults to VT.
For QRS Complexes With RBBB Categorization:
Is there an rSR′ morphology in lead V1?

Is there an RS complex in V6 (may have a small septal Q wave)?

Is the R/S ratio in lead V6 > 1?
For QRS Complexes With LBBB Categorization:
Is there an rS or QS complex in leads V1 and V2?
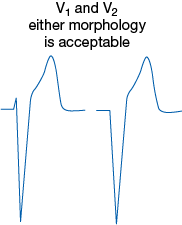
Is the onset of the QRS to the nadir of the S wave in lead V1 < 70 ms?
Is there an R wave in lead V6, without a Q wave?

Polymorphic Ventricular Tachycardia and Ventricular Fibrillation In polymorphic ventricular tachycardia and ventricular fibrillation, the ventricles are often activated continuously in chaotic fashion by disorganized wavelets of activation that produce irregular QRS complexes with no isoelectric periods. Both ventricular fibrillation and polymorphic ventricular tachycardia are life-threatening conditions that require prompt defibrillation. The distinction between ventricular fibrillation and polymorphic ventricular tachycardia is simply based on the amplitude of the QRS complexes and has very little clinical utility. The most common cause of polymorphic ventricular tachycardia and ventricular fibrillation is myocardial ischemia due to coronary artery occlusion.
Torsade de Pointes Torsade de pointes (“twisting of the points”) is a specific form of polymorphic VT that is often pause dependent, has a characteristic shifting morphology of the QRS complex, and occurs in the setting of a prolonged QT interval. Torsade de pointes is associated with drug-induced states, congenital long QT syndrome, and hypokalemia (See Right Superior Axis Deviation).
Atrial Fibrillation with Anterograde Accessory Pathway Activation If a patient with an accessory pathway develops atrial fibrillation, the ventricles are activated by both the normal AV node-His bundle axis and the accessory pathway. Because the accessory pathway does not have decremental conduction properties, it allows very rapid activation of the ventricles. The combination of an irregular wide complex rhythm with very rapid rates (250–300 bpm) should arouse suspicion of this scenario, particularly in a young, otherwise healthy patient.
Bradycardia Slow heart rates can be due to failure of impulse formation (sinus node dysfunction) or blocked AV conduction.
Sinus node dysfunction is manifested in a number of ECG findings. Most commonly, there is a sinus pause with a junctional escape beat. Alternatively, sinus bradycardia can be associated with sinus node dysfunction.
Sinus Bradycardia: The normal range of sinus rates changes with age. In infants less than 12 months old, the mean heart rate is 140 bpm with a range of 100–190 bpm. In contrast, the normal range for adults is probably 50–90 bpm. Sinus rates less than 60 bpm are classified as sinus bradycardia, but it must be remembered that sinus rates of less than 60 bpm are commonly observed (sleep, athletes). Treatment of sinus bradycardia (usually with a pacemaker) is indicated only when it is associated with symptoms, not because of a specific heart rate.
Sinus Pauses: In some individuals, the sinus node abruptly stops firing, leading to sinus pauses. Usually an escape rhythm from an ectopic atrial focus or the junction prevents asystole. Sinus pauses up to 2 seconds are seen in normal adults. Patients with sinus pauses >3 seconds should be evaluated for the presence of sinus node dysfunction.
Junctional Rhythm: If the sinus node rate is very low, sustained junctional rhythm can sometimes be observed. In junctional rhythm, the QRS is not preceded by a P wave. A retrograde P wave can sometimes be seen in the initial portion or terminal portion of the QRS complex, but most commonly it is “buried” in the QRS complex. Normally, junctional rhythms are <60 bpm. Transient junctional rhythm can be observed in normal individuals during sleep, but sinus node dysfunction should be suspected if junctional rhythm is observed when a patient is awake.
In rare circumstances, accelerated junctional rhythms between 60 and 100 bpm are observed due to more rapid depolarization of AV nodal cells. If the junctional rate is faster than the sinus rate, the sinus node will be suppressed by retrograde atrial activation because of repetitive depolarization from the junction. Accelerated junctional rhythms can be present in digitalis toxicity, rheumatic fever, and after cardiac surgery.
Because AV conduction normally occurs along a single axis, the AV node and His bundle, atrioventricular (AV) block most commonly is due to block at one of these two sites. Block within the His bundle is associated with a worse prognosis and should be suspected in any form of AV block associated with a wide QRS complex. Electrocardiographically, AV block is usually described as first-degree, second-degree, or third-degree AV block. In first-degree (1°) AV block, every P wave is conducted to the ventricles, but there is an abnormal delay between atrial activation and ventricular activation (PR interval >0.2 second). In 1° AV block, the ventricular rate is not slow unless sinus bradycardia is also present.
In second-degree (2°) AV block, some but not all P waves are conducted to the ventricles. This leads to an irregular ventricular rhythm. Second-degree AV block is usually subclassified as Mobitz type I block, Wenckebach block or Mobitz type II block. In type I 2° AV block, progressive prolongation of the PR interval is observed; in type II 2° AV block, the PR interval remains relatively constant before the blocked P wave. The importance of this distinction is this: type I 2° AV block usually indicates that conduction is blocked within the AV node, whereas type II AV block suggests that conduction is blocked within the His bundle (regardless of the width of the QRS complex). The simplest way to differentiate between type I and type II 2° AV block is to compare the PR intervals before and after the block P wave. In type I 2° AV block, the PR interval after the blocked P wave is shorter than the PR interval before the blocked P wave; in type II 2° AV block, the PR intervals are the same.
In third-degree (3°) or complete AV block, no P waves are conducted to the ventricles. The P-to-P and QRS-to-QRS intervals are constant and unrelated (AV dissociation). The QRS rate and morphology depend on the site of the subsidiary intrinsic pacemaker. If the block is within the AV node, a lower AV nodal pacemaker often takes over and the rate is 40–50 bpm with a normal-appearing QRS complex (junctional rhythm). If the block is within the His bundle, a ventricular pacemaker with a rate of 20–40 bpm and a wide QRS will be noted (ventricular escape rhythm).
Step Two: Morphologic Diagnosis of the Cardiac Waveforms
The most common pattern is illustrated below and is usually seen in leads I or II and V6. There is a small “septal” Q wave <30 ms in duration. The T wave is upright. The normal ST segment, which is never normally isoelectric except sometimes at slow rates (<60 bpm), slopes upward into an upright T wave, whose proximal angle is more obtuse than the distal angle. The normal T wave is never symmetric.
The pattern seen in the right precordial leads, usually V1–3, is shown below. There is a dominant S wave. The J point—the junction between the end of the QRS complex and the ST segment—is usually slightly elevated, and the T wave is upright. The T wave in V1 may occasionally be inverted as a normal finding in up to 50% of young women and 25% of young men, but this finding is usually abnormal in adult males. V2 usually has the largest absolute QRS and T-wave magnitude of any of the 12 electrocardiographic leads.
Diagnostic criteria include a positive component of the P wave in lead V1 or V2 ≥1.5 mm. Another criterion is a P-wave amplitude in lead II >2.5 mm.
Note: A tall, peaked P in lead II may represent RAE but is more commonly due to either chronic obstructive pulmonary disease (COPD) or increased sympathetic tone.
Clinical correlation: RAE is seen with right ventricular hypertrophy (RVH).
The most sensitive lead for the diagnosis of LAE is lead V1, but the criteria for lead II are more specific. Criteria include a terminal negative wave ≥1 mm deep and ≥ 40 ms wide (one small box by one small box in area) for lead V1 and > 40 ms between the first (right) and second (left) atrial components of the P wave in lead II, or a P-wave duration >110 ms in lead II.
Clinical correlations: left ventricular hypertrophy (LVH), coronary artery disease, mitral valve disease, or cardiomyopathy.
Stay updated, free articles. Join our Telegram channel

Full access? Get Clinical Tree


