Learning Objectives
To understand the concepts of sensitivity, specificity, predictive value, prevalence, and incidence.
To learn the frequently encountered preanalytical variables that influence laboratory test results.
To identify the well-known interferences in many of the laboratory tests.
To understand the individual steps in specimen processing and handling.
To understand the guidelines for appropriate selection of laboratory tests.
To understand how cell injury and inflammation result in the generation of plasma markers of these processes.
An understanding of the principles set forth in this chapter is essential for the appropriate selection of laboratory tests and the accurate interpretation of the test results.
Analytical and Statistical Concepts in Data Analysis
In clinical practice, the laboratory test result is typically placed alongside a range of values for that test. In most cases, this is the reference range, which is often considered to be the normal range. It is important to understand that individuals with values inside the reference range may have subclinical disease, despite the presence of an apparently normal value. The reference range is dependent on the instrument and reagent used to perform the test. The reference ranges are ideally established inside the laboratory where the test is being performed. Reference ranges supplied by instrument and reagent manufacturers are not likely to correspond perfectly to ranges generated within an individual laboratory. This is because the population used to establish the range by the manufacturer and/or the instruments and reagents used by the manufacturer are likely to be different from those in an individual clinical laboratory.
To obtain a reference range, individuals without disease and on no medications donate samples for testing. A distribution of these values, which should be numerous enough to be statistically reliable, is plotted. The data are not always distributed in a Gaussian pattern. Therefore, statistical methods that are nonparametric are used to identify the central 95% of values. This range, representing the middle 95% of results, is the reference range. As an indication that being outside the reference range does not always reflect the disease, 5% of normal healthy, nonmedicated individuals who donated samples for the reference range determination now fall outside of what has become the reference range for the test.
To obtain a reference range, individuals without disease and on no medications donate samples for testing. The middle 95% of results is the reference range.
Several decades ago, the results for cholesterol testing demonstrated that individuals eating a high-fat diet showed high cholesterol levels that were associated with atherosclerotic vascular disease. When these apparently healthy, nonmedicated individuals provided samples for reference range determinations, the central 95% of values from this population provided an inappropriately high reference range. Therefore, the use of the classical reference range for selected laboratory tests in certain populations was not recommended. For that reason, desirable or prognosis-related ranges were developed. These are commonly established by groups of experts associating laboratory test results with clinical outcome.
For certain medications, a therapeutic window exists to provide a target for a blood, plasma, or serum level for the medication. Values below the therapeutic range typically reflect an inadequate amount of medication, and values above the therapeutic range may be associated with a particular toxic effect. In some cases, the therapeutic range does not reflect the amount of medication in the blood, but instead reflects a therapeutic effect produced by the drug. For example, patients taking the drug warfarin are not monitored with warfarin levels in the blood. Instead, the warfarin decreases the level of coagulation factors, which results in a prolonged prothrombin time (PT), and a calculated value known as the international normalized ratio (INR). The therapeutic range of warfarin, therefore, is determined by its effect rather than its concentration in the blood.
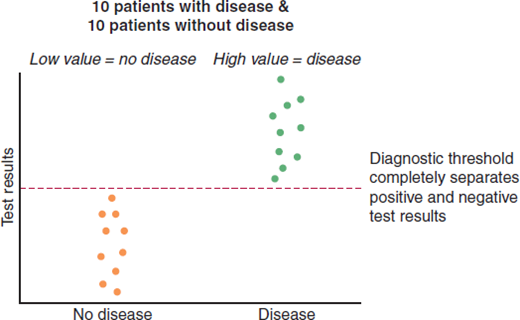
For certain laboratory tests, the presence of disease is associated with a value that is above a threshold.
For certain laboratory tests, the presence of disease is associated with a value that is above a threshold. The use of troponin as a marker for myocardial infarction involves a threshold value, such that a level above the threshold is consistent with cardiac ischemia. Another prominent example is related to the detection of drugs of abuse. Any level above zero, as a threshold value, provides evidence for the ingestion of an illicit drug.
For laboratory tests that show too much variability to permit the use of a range or a threshold, an individual laboratory result for a specific patient can be compared with a result for that same patient that was generated previously. The longitudinal analysis of results over time can indicate the progression or regression of the disease.
Figure 1–1 shows 2 populations of individuals and their results for a particular test. All of the individuals who do not have disease have a low value for the test, and all of the individuals with disease have a high value for the test. There is no overlap between groups in Figure 1–1. In Figure 1–2, a more commonly encountered situation is shown. There is overlap in laboratory values between individuals with disease and those without disease. This means that the diagnostic threshold will necessarily misclassify some patients to create false-positives, false-negatives, or both.
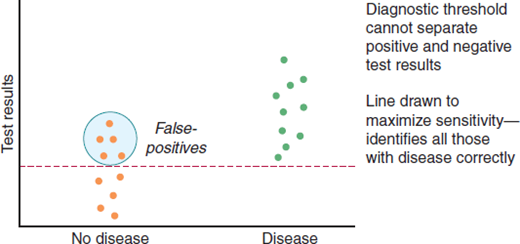
The population of individuals who have disease is the focus of sensitivity. The sensitivity of a laboratory test is its capacity to identify all individuals with disease. The threshold used in Figure 1–2 maximizes sensitivity by placing all those with disease above the line. This placement of the diagnostic threshold would decrease the number of false-negatives (those with disease who fall below the line), because everybody with the disease would have a positive test result. However, there is a significant misclassification of individuals without disease. As the diagnostic threshold is lowered, an increasing number of patients without disease would be told they have a positive test result, and by implication, the disease in question. The formula for sensitivity is:
True-positives and false-negatives are groups with disease; as noted above, sensitivity focuses on those with disease.
The sensitivity of a laboratory test is its capacity to identify all individuals with disease. Specificity is a statistical term that indicates the effectiveness of a test to correctly identify those without disease.
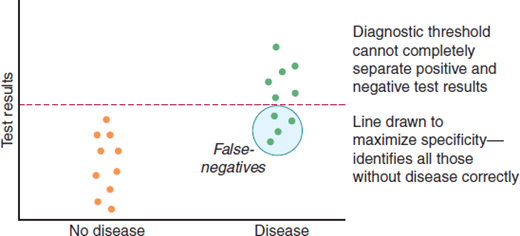
The population of individuals without disease is the focus of specificity. Specificity is a statistical term that indicates the effectiveness of a test to correctly identify those without disease. When used to describe a laboratory test, it does not refer to its ability to diagnose a “specific” disease among a group of related disorders. One could maximize specificity by raising the threshold shown in Figure 1–3 to place all those without disease below the line. This would decrease the number of false-positives because everyone without disease would have a negative test result. However, there would be a significant misclassification of the individuals with disease. As the diagnostic threshold is raised, an increasing number of patients with disease would be told they have a negative test result and, by implication, no disease. The formula for specificity is:
True-negatives and false-positives are the groups without disease; as noted above, specificity focuses on those without disease.
For diseases that are serious and treatable, and for which a second confirmatory laboratory test exists, it is important to maximize sensitivity as in Figure 1–2. For example, for diagnosis of AIDS, it is better to have a few false-positives that can be subsequently correctly identified with a confirmatory test than to fail to identify individuals with HIV infection who might unknowingly infect others. However, for diseases that are serious and not curable, a false-positive result is catastrophic for the patient. For such diseases, such as pancreatic cancer, it is better to use the threshold shown in Figure 1–3 for diagnosis because if individuals with disease are missed, it will have no effect on the treatment or outcome. When there are no compelling reasons to maximize either sensitivity or specificity, the threshold value should be established to minimize the total number of false-positives and false-negatives, as shown in Figure 1–4.
Stay updated, free articles. Join our Telegram channel

Full access? Get Clinical Tree


