Clinical Chemistry
Jude Abadie
D. Robert Dufour
▪ Questions and Answers
1. Based on a normal distribution of quality control (QC) data, which description of a QC rule best represents imprecision? For each case, assume that the same QC material is used in one run.
a. Three sequential observations for a QC specimen that exceed 2 standard deviations from the target value in the same direction
b. 10 sequential observations that fall between 3 and 4 standard deviations above the mean
c. Eight sequential observations that exceed one standard deviation in the same direction from the target value
d. Six sequential observations that all fall exactly one and a half standard deviation below the mean
e. Two sequential observations with a range of four standard deviations between the two values
View Answer
1. e. Choice A represents systematic bias. Choices B and C represent both systematic bias and a trend. Choice D represents a shift and demonstrates excellent precision. Choice E represents a system demonstrating poor precision.
2. The following Levey-Jennings chart (Fig. 17.1) represents the “low” glucose quality control whose mean has been established at 80 mg/dL (represented by the solid horizontal line). Values for 3 consecutive days of the run are indicated by the three asterisks. The dotted lines represent standard deviations (SD) above and below the mean and are labeled with the corresponding glucose value in mg/dL in parentheses. What is the probability that the event below occurred by chance alone?
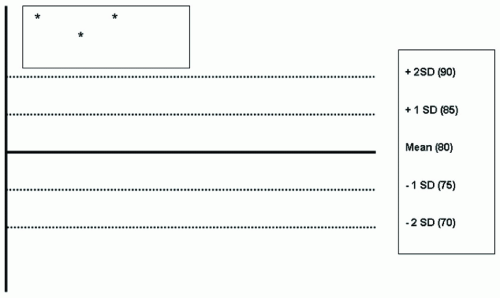 Figure 17.1 |
a. 1:64,000
b. 1:32,000
c. 1:16,000
d. 1:8,000
e. 1:4,000
View Answer
2. a. Another way of asking the same question is: “What is the probability that three consecutive values will fall greater than 2 SD above the mean or greater than 90 mg/dL?” This question can be viewed as a normal (Gaussian) distribution with a 95% confidence interval. The probability that one value will fall outside of this 95% confidence interval is 5%. However, the probability of one value falling greater than 2 SD above the mean is 2.5% (1/40). Therefore, the probability that three consecutive values will all fall greater than 2 SD above the mean is the product of each of the individual probabilities or (1/40)(1/40)(1/40) or 1 in 64,000. This event is not likely to occur by chance alone.
3. Which of the following is the best statistical test to determine if the null hypothesis is correct in stating that no significant difference exists between the variances for two study groups?
a. Chi-square test
b. F-test
c. Analysis of variance (ANOVA)
d. T-test
e. Sign test
View Answer
3. b. Chi-squared analysis evaluates observed and expected observations to determine if populations are related. ANOVA is a method for testing the hypothesis that three or more groups with normal distributions are the same. The sign test is similar to the t-test except that it uses the median rather than the mean. The F-test (aka: variance ratio test) is used to determine if standard deviations of two data sets are statically different. The F-test statistic is calculated by dividing the square of the larger variance by the square of the smaller variance. This value is evaluated using degree of freedom and an appropriate table.
4. In a chronic hepatitis study, serum alkaline phosphatase (ALP) levels were reported for patients with inactive and patients with active disease. The variances are not significantly different from one another. This data appears as follows:
Inactive Disease | Active Disease | |
|---|---|---|
Mean (IU/L) | 90 | 140 |
Variance | 15 | 20 |
N | 10 | 20 |
Which of the following is the best statistical test to determine if the means are different?
a. Unpaired t-test
b. Paired t-test
c. Gap test
d. Linear regression analysis
e. Confidence interval test
View Answer
4. a. The unpaired (student) t-test is used to compare two groups of observations that are unrelated to each other, such as diseased and non-diseased groups. The sample sizes do not have to be different. The paired t-test evaluates data derived from a single group (samples, patients) in which two different procedures or treatments are evaluated for differences.
5. In Figure 17.2, the x axis represents results for a test, and the y axis represents frequency of individuals with the corresponding value. Changing the limit of normal values for the test from 10 to 20 (as indicated on the figure) would result in:
a. Decreased specificity
b. Increased negative predictive value and increased sensitivity
c. Decreased false positives and decreased false negatives
d. Increased false positives and decreased false negatives
e. Decreased false positives and increased false negatives
View Answer
5. e. With this change, fewer healthy individuals will be called positive. As you move to the right, the positive predictive value increases and negative predictive value decreases.
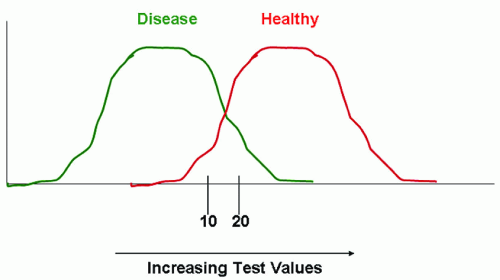 Figure 17.2 |
6. In which of the following common measurement variability would LEAST likely demonstrate a Gaussian statistical distribution?
a. Aspiration volume
b. Electronic noise in a measuring system
c. Control material deterioration in storage
d. Instrument temperature measurements over a 1-month period
e. Precision study results
View Answer
6. c. Choice C would likely demonstrate a shift or a drift. All others should demonstrate a Gaussian distribution. This distribution type is also known as a normal distribution wherein the population of data clusters symmetrically around a central value such that the mean, median, and mode of the data set are all identical.
7. Which of the following statements regarding proficiency testing (PT) is considered to be an UNACCEPTABLE laboratory practice?
a. PT should be used as a process of external evaluation of method performance.
b. The laboratory should use an alternative approach to verify method performance when PT is not offered.
c. PT data should be compared among laboratories using the same methods.
d. If the primary facility analyzer is undergoing maintenance, PT surveys can be resulted and reported from testing conducted at a reference laboratory.
e. PT allows for peer group evaluation.
View Answer
7. d. CLIA-88 prohibits survey material to be shared among different facilities and laboratories. The PT survey should be used only for its intended facility and platform. Peer group evaluation allows a laboratory to verify that it is using a method according to manufacturer’s specifications. Furthermore, it demonstrates that patient results are consistent with those of other laboratories.
Questions 8-10:
A new test is developed to test for an inherited metabolic disease. The disorder is found in 1 in 10,000 newborn infants. The test was evaluated in 300 healthy newborn infants, and 6 had results that were above the normal upper reference limits. Of a series of 100 banked samples from children with the disorder, 95 had results above the normal reference limits.
8. The sensitivity of this test for the metabolic disorder is:
a. 2%
b. 5%
c. 25%
d. 95%
e. 98%
View Answer
8. d. Sensitivity is defined as the percentage of individuals with a disease who have an abnormal result. Of the 100 children with the disease, 95 (95%) had an abnormal result.
9. The specificity of this test for the metabolic disorder is:
a. 2%
b. 5%
c. 25%
d. 95%
e. 98%
View Answer
9. e. Specificity is defined as percentage of normal results in individuals without the disease. Of the 300 children without the disease, 294 (300-6, or 98%) had a normal result.
10. The positive predictive value of the test when used to screen all newborns for the disease is:
a. 0.0001%
b. 0.5%
c. 5%
d. 50%
e. 95%
View Answer
10. b. When tested in a screening program, one must use the prevalence of disease to evaluate the predictive value. When calculating predictive value problems for the boards, approximations will allow you to determine the correct answer. If the test has 95% sensitivity, then it is likely that the one infant with disease will have a positive result. Of the 10,000 (actually 9,999) without disease, 2% would be expected to have an elevated value; this represents 200 individuals. The positive predictive value is calculated as the true positive results (1) divided by total positive results (201), multiplied by 100 to report it as a percent, or in this case 0.5%. It is not appropriate to use the 300 persons without disease and 100 persons with disease initially tested to calculate positive predictive value, because this does not represent the true frequency of disease in the population tested.
Questions 11-13:
A study is done to evaluate three tests for diagnosis of a disease, as illustrated in the ROC curve in Figure 17.3. Test A is the currently established screening test, Test B is another test that has been proposed, and Test C is a new test developed in the author’s laboratory.
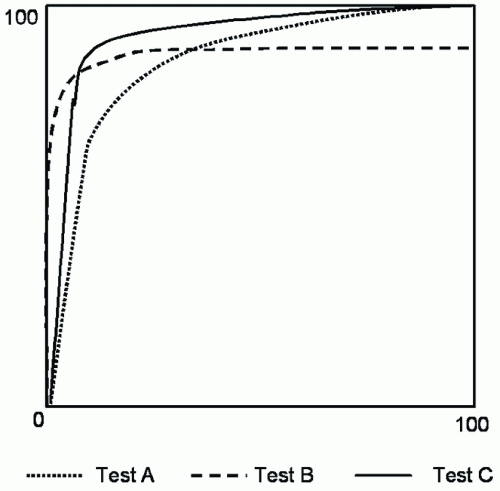 Figure 17.3 |
11. Which of the following statements is correct about this ROC analysis?
a. False positive rate is displayed on the y axis.
b. Predictive value is displayed on the y axis.
c. Sensitivity is displayed on the x axis.
d. Specificity is displayed on the x axis.
e. True positive rate is displayed on the y axis.
View Answer
11. e. In an ROC curve, true positive rate or sensitivity is plotted on the y axis, and false-positive rate (100-specificity) is plotted on the x axis. In some versions of the plot, specificity is plotted on the x axis, but in that case the numbers on the x axis go from 100 on the left to 0 on the right.
12. In evaluating test performance, which of the following statements is correct?
a. None of the tests appears to perform better than chance alone.
b. Test A is more specific than either of the other two tests regardless of the decision level chosen.
c. Test B would be a better choice for a screening test than the other two tests.
d. Test B would be the best choice as a confirmatory test.
e. Test C is more sensitive than the other two tests regardless of the decision level chosen.
View Answer
12. c. In evaluating an ROC curve comparing more than one test, several features of the graph can be used to compare test performance against expectations. In viewing the graph, tests A and B reach sensitivity of approximately 100%; however, test A clearly has better specificity for any level of sensitivity chosen. In screening programs, sensitivity is the most important characteristic of test performance. On the other hand, test C has high specificity, but never reaches over approximately 80% sensitivity. Confirmatory tests require high specificity, so test C would be a good choice for a confirmatory test. Chance alone would be depicted by a straight line running from the lower left-hand corner to the upper right-hand corner of the graph. All of the tests perform significantly better than chance alone.
13. Which of the following statements concerning use of ROC curves is INCORRECT?
a. Area under the curve (AUC) is typically used to evaluate test performance, with higher numbers indicating better overall performance.
b. For maximum diagnostic efficiency, the point closest to the upper left hand corner of the graph is used.
c. If area under the curve is 0.60 (60%), this test is only slightly better than expected by chance alone.
d. In comparing two tests, area under the curve is the best way to determine which test is better for screening or for confirmation of disease.
e. ROC curves are prepared by determining the sensitivity and specificity of a given test at multiple cutoff points.
View Answer
13. d. ROC curves are prepared by calculating sensitivity and specificity of a test at a number of different cutoff points. Inspection of the graphs is the best way to determine tests that may perform better as screening tests (high sensitivity) or confirmatory tests (high specificity). Area under the curve (i.e., the proportion of the square below and to the right of the ROC curve) is a common way to evaluate overall test performance; the higher the number (with 1.0 being a perfect test), the better. Since a straight line from the lower left to upper right corners (performance of chance alone) will include an AUC of 0.50, an AUC of 0.6 is only slightly better than chance alone. Efficiency refers to the proportion of all persons who are correctly classified by a test (true positive + true negative/total tested). Efficiency will be highest at that point closest to the upper left-hand corner of the graph.
Questions 14-15:
A laboratory has purchased a new analyzer to measure α-fetoprotein (AFP). Thirty different samples are analyzed for AFP using the new analyzer and the old analyzer. The mean ± 1 SD for AFP using the new analyzer was 6.7 ± 0.7 ng/mL, and 6.1 ± 1.0 ng/mL using the old analyzer.
14. Which statistical test would be the best way to determine whether the means of the two methods were significantly different?
a. Chi-square test
b. F-test
c. Kolmogorov-Smirnov test
d. Paired t-test
e. Unpaired t-test
15. Which statistical test should be used to determine whether the standard deviations of the two methods are significantly different?
a Chi-square test
b. F-test
c. Kolmogorov-Smirnov test
d. Paired t-test
e. Unpaired t-test
View Answer
15. b. The t-test is a statistical evaluation of whether the means of two sets of observations (which have a gaussian distribution of results) are significantly different. There are several versions of the t-test, but the ones that cause the most confusion (and are often asked about on exams) are paired and unpaired t-tests. Basically, if the same samples or individuals are studied using two different drugs or two different tests, the paired t-test would be used. If different individuals or samples are studied, then the unpaired t-test would be used. The chi square test is typically used for evaluating differences in proportions between two groups. For example, consider a treatment for a disease. If 24/75 persons treated with drug A responded, while 10/57 treated with drug B responded, the response rates could be evaluated using the chi square test. The Kolmogorov-Smirnov test is used to determine whether a set of data follows a gaussian distribution.
16. To validate that a previously published reference interval is appropriate for the population served by a laboratory, which of the following criteria should be used?
a. Ten apparently healthy individuals are studied; the range is appropriate if no more than one is outside of the published reference limits.
b. 20 apparently healthy individuals are studied; the range is appropriate if no more than 2 are outside of the published reference limits.
c. 30 apparently healthy individuals are studied; the range is appropriate if no more than 6 are outside of the published reference limits.
d. 50 apparently healthy individuals are studied; the range is appropriate if no more than 10 are outside of the published reference limits.
e. None of the above. Validation of reference intervals is not acceptable and a laboratory must always establish its own reference limits.
View Answer
16. b. According to the Clinical and Laboratory Standards Institute (CLSI), a laboratory is allowed to use a published reference interval, providing that it has validated that the reference interval is appropriate for its population. The approved protocol for performing this is to take 20 representative individuals and test their samples; if no more than two of the results are outside the published reference interval, it is said to be validated. If more than two are outside the interval, a second series of 20 can be tested, and the same criterion used to make sure the first observation was just by chance. Practically speaking, one would not wish to repeat this experiment if, say, half of the results were outside the published reference interval. If the published figures cannot be validated, then the laboratory must establish its own reference interval.
17. To establish a reference interval, assuming the results of the test have a Gaussian distribution (or can be transformed to a Gaussian distribution), how many individuals must be tested?
a. 20
b. 60
c. 120
d. 200
e. None of the above. The exact number depends on the cost of the test reagents.
View Answer
17. c. According to the CLSI standards, to achieve statistical reliability in determining limits for a reference interval, 120 individuals must be tested. The data should be inspected for outliers, and calculations repeated after excluding any such outlier data points.
18. Upper reference limits for glucose and total cholesterol were established:
a. As the 95th percentile of results from all apparently healthy individuals
b. As the 97.5th percentile of results from all apparently healthy individuals
c. As the 99th percentile of results from all apparently healthy individuals
d. Based on outcomes data, at the point where risk of subsequent disease manifestations (diabetic complications, coronary artery disease) began to increase
e. Separately by age (decades) at two standard deviations above the mean of individuals free from symptoms of coronary artery disease
View Answer
18. d. In contrast to most other tests, upper reference limits for cholesterol and glucose are based on subsequent risk of developing clinical evidence of disease. By analyzing results of prospective studies, and analyzing test results at baseline, the values above which risk began to increase were chosen as the upper reference limits of healthy or desirable. In the case of cholesterol, this was at values markedly lower than would have been derived from studies of apparently healthy individuals, while for glucose it is at values markedly higher than from such studies.
19. For which of the following tests are reference intervals derived as the central 95% of results from apparently healthy individuals insensitive to disease-induced changes in a patient?
a. Albumin
b. BUN
c. Free thyroxine
d. Potassium
e. Sodium
View Answer
19. c. For many tests, results within a person are kept within extremely narrow limits, while varying considerably from one person to the next. For such tests, population-based reference limits are insensitive to the presence of disease. Among common tests with small individual variation are alkaline phosphatase, calcium, and free thyroxine. On the other hand, individual variation is similar to population variation for the other tests listed here, along with phosphate.
a. 5%
b. 25%
c. 50%
d. 80%
e. 95%
View Answer
20. c. This can be calculated similarly to calculating the odds that all 12 coin flips would turn up heads or tails. In that case, the likelihood of one flip resulting in a head is 0.5 (50%); the odds that all 12 would be heads is (0.5)12. Assuming all tests are independent variables, then the likelihood that all 12 would be within the reference interval is the likelihood of 1 (0.95) to the 12th power. The exact answer is 54%. This type of question commonly appears on the boards.
21. Which of the following tubes should be filled LAST during phlebotomy?
a. Blood culture tubes
b. EDTA (lavender top)
c. Nonadditive tubes (plain red top tubes)
d. Serum separator tubes
e. Sodium citrate (light blue top)
View Answer
21. b. According to the CLSI guidelines on blood collection, the suggested order of collection is blood culture tubes first, followed (in order) by plain tubes, coagulation (sodium citrate) tubes, serum separator tubes, and tubes with additives. For plastic tubes, however, “plain” tubes often contain additives to accelerate coagulation; when plastic tubes are used, sodium citrate tubes should be filled before the “plain” tubes.
22. Prolonged use of a tourniquet would be expected to increase which of the following tests?
a. BUN
b. Calcium
c. Creatinine
d. Glucose
e. Sodium
View Answer
22. b. Prolonged use of a tourniquet causes hemoconcentration, which can increase the concentration of proteins and substances bound to proteins (calcium, iron, lipids, protein-bound hormones, and drugs).
23. Which of the following substances DO NOT show significant diurnal variation?
a. Creatinine
b. Glucose tolerance
c. Growth hormone
d. N-telopeptides of collagen
e. Osteocalcin
View Answer
23. a. While diurnal variation is best known for cortisol, there is significant diurnal variation for many other substances as well. Most pituitary hormone levels are lowest at bedtime and rise significantly during sleep to peak in the morning. Substances regulated by pituitary hormones (including many bone markers, such as osteocalcin, and collagen degradation fragments, such as N-telopeptides) also have marked diurnal variation. Glucose tolerance is affected by cortisol and growth hormone levels and is significantly better in the afternoon than in the morning.
24. Which of the following tests should have lower reference limits during pregnancy?
a. Alkaline phosphatase
b. Creatinine
c. Estriol
d. Prolactin
e. Renin
View Answer
24. b. During pregnancy, there is an increase in glomerular filtration rate of approximately 50%, resulting in a significant decrease in BUN and creatinine. It is important to consider this decrease in interpreting renal function tests during pregnancy. Increases in reference limits are needed for each of the other tests. Alkaline phosphatase levels increase to two-three times the nonpregnant reference limits, both from placental alkaline phosphatase and an increase in bone isoenzyme. During the second trimester, third spacing of fluid increases renin and aldosterone production. A number of hormones increase during pregnancy, including estriol (a marker of the fetal-placental unit) and prolactin.
25. During acute illness, increases occur in all of the following parameters EXCEPT:
a. Cholesterol
b. Cortisol
c. Glucose
d. Growth hormone
e. Triglycerides
View Answer
25. a. Acute illness causes a number of changes in physiology. Cytokines lead to increased production of several pituitary hormones, including cortisol, growth hormone, and prolactin; however, gonadotropins are typically decreased. Increased cortisol causes increases in glucose and worsens glucose tolerance. Cytokines appear to increase uptake of cholesterol by macrophages; with acute illness, cholesterol often falls by up to 40%, and the decrease begins within 24 hours of onset of illness. Similar decreases occur in LDL-cholesterol, with lesser decreases in HDL-cholesterol, while triglycerides and VLDL increase by up to 35%.
26. Which of the following preanalytical variables is most likely related to specimen handling?
a. Drug regimen
b. Physical activity
c. Site preparation
d. Clotting
e. Body posture
View Answer
26. d. Drug regimen and physical activity are more related to subject preparation. Site preparation and body posture are more related to specimen collection. Clotting is the only choice most likely related to specimen handling.
27. Which of the following additives causes an increase in the corresponding analyte?
Additive | Analyte | |
|---|---|---|
a. | EDTA | Iron |
b. | Oxalate | Calcium |
c. | Citrate | Amylase |
d. | Fluorides | Alkaline phosphatase |
e. | Heparin | Free thyroxine |
View Answer
27. e. Heparin causes increases in laboratory testing such as thyroid hormone, PT, PTT, Li (Li-Heparin tubes), and sodium (Na-Heparin tubes). EDTA decreases iron; oxalate decreases calcium levels; citrate decreases amylase, and fluorides inhibit alkaline phosphatase activity.
28. Which of the following would have the highest interand intraindividual CV?
a. C-peptide
b. Calcium
c. Blood glycohemoglobin
d. Total protein
e. Plasma glucose
View Answer
28. a. C-peptide has about a 65% inter- and a 30% intraindividual CV. Calcium, glycohemoglobin, total protein, and glucose demonstrate at most ∼ 10% CV for either inter- or intraindividual CV.
Questions 29-31:
A laboratory is evaluating a new method for measuring urea (BUN). A method (DXc) comparison study is performed comparing the new method (LXi) with an established method in the laboratory. The linearity of the two methods is up to 100 mg/dL.
29. The results of the two methods are compared using linear regression analysis, as illustrated in Figure 17.4. The equation for the regression line is y = 0.97 × + 2.9. Which of the following statements is correct concerning this correlation?
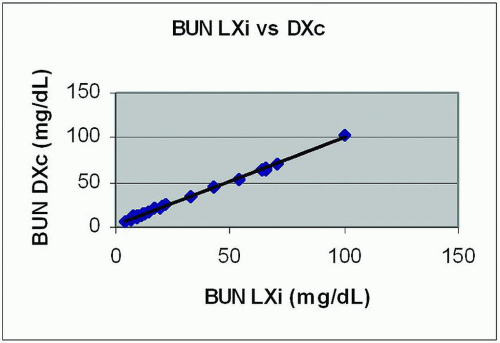 Figure 17.4 |
a. The correlation was done incorrectly; the new method should be plotted on the x axis, while the old method is plotted on the y axis.
b. The range of values indicated on the graph is inadequate to evaluate the performance of the new method.
c. The slope (0.97) indicates that there is no significant constant bias in the new method.
d. The spread of the points around the line is minimal, indicating that there should be a high correlation coefficient for the data.
e. The y-intercept (2.9) indicates that there is no significant proportional bias between the two methods.
View Answer
29. d. Comparison studies are typically graphed using the current (or, ideally, a reference) method on the x axis and the new or comparison method on the y axis. Correlation coefficient is reflective of two things: the spread of points around the line and the range of values measured. High correlation coefficients occur when an adequate range of samples is tested and when the points are closely fit to the resulting line. Slope is a measure of proportional bias, while y intercept is a measure of constant bias.
30. The correlation coefficient for the experiment, r, was 0.998. Which of the following statements is correct?
a. The probability of a given X value accurately predicting the corresponding Y value (within the range measured) is >99%.
b. Since the r value was >0.9, it is not necessary to evaluate the method for constant or proportional bias.
c. There is no significant difference between the results using the two methods.
d. The square of the r value, R, is a measure of average difference between the two methods.
e. The low value for r (<1) indicates that there is poor agreement between the two methods.
View Answer
30. a. Correlation coefficient is only a measure of fit of points to the line and an indicator of the range of the values measured. A perfect positive correlation would occur with an r value of 1, while a perfect negative correlation would be indicated by an r of − 1. A value of 0 indicates that there is no correlation between the two methods. The square of r (also called R), when expressed as a percentage, indicates the likelihood of predicting the value of y for a given x value. For method comparison studies, values of r should ideally be >0.97, and for most methods will be >0.99 unless there are significant problems with the comparison study. The square of the r value indicates how much of the individual value for y can be explained by the x variable; for method comparison studies, this should therefore be a very high number. The correlation coefficient does not indicate that values are equal; for example, a new method for an enzyme could give results three times those of the old method, but as long as that relationship always held, the r value would be high; as a consequence of this fact, correlation coefficient cannot be used to evaluate methods for bias.
31. The graph (Fig. 17.5) illustrates the difference between results of the old and new methods displayed as a function of the value for BUN obtained using the current method using a bias (Bland-Altman) plot. Which of the following statements is correct?
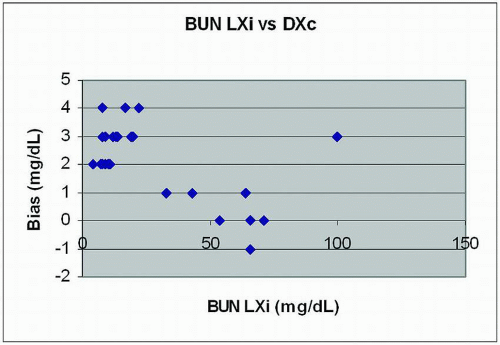 Figure 17.5 |
a. There is a proportional bias between the new and old methods at values above 20 mg/dL.
b. There is a constant bias of about 3 mg/dL at values below 20 mg/dL.
c. There is a proportional bias of about 3% at values below 20 mg/dL.
d. There is a constant bias of about 1 mg/dL at all values.
e. There is a proportional bias of 2% at all values.
View Answer
31. b. Bias (Bland-Altman) plots are the most sensitive way to detect biases, particularly those that occur only in part of the measurement range. Bias plots can use either the absolute difference or the percent difference. When using either, the goal is to have the points centered on the zero line, with about half above and half below. Values that are consistently on one side of the zero line represent bias in that part of the measurement range.
32. A clinician questions the results on an hCG value on a female patient. She had undergone D & C of a complete hydatidiform mole approximately six months previously, and had normal hCG levels at another hospital; your lab reported an hCG of 240 IU/mL. The patient had gone to the other hospital for further treatment, but their laboratory had measured hCG as <0.5 IU/mL. A repeat sample in your laboratory one month later gave an hCG of 236 IU/mL, but was again negative at the other laboratory. By accident, a technologist in your laboratory had also performed a PSA on the sample, and a value of 6.2 ng/mL was obtained. Which of the following is the most likely explanation for these values?
a. Different calibrators are used by the two assays, and this represents common methodological differences in results.
b. Heterophile antibodies are present and are causing false elevations of both PSA and hCG.
c. The sample contains beta core fragment, which is not detected by all serum hCG assays.
d. The sample contains free alpha subunits, a known cause for discrepant results in hCG assays.
e. Tumor recurrence is present, and the tumor is also causing ectopic production of PSA.
View Answer
32. b. Heterophile antibodies are a common cause of erroneous results in sandwich immunoassays, which are used to measure most tumor markers, peptide hormones, cardiac markers, and a number of other compounds. These antibodies react with immunoglobulins from other species, which may generate a signal in the immunoassay that is read as the presence of the analyte. While manufacturers take steps to minimize heterophile antibody interference, they vary in their effectiveness (even within different assays from the same manufacturer), so discrepant results are common in samples containing high titer heterophile antibodies. While fragments of hCG may also cause discrepant hCG results, they would not explain the positive PSA in a female, and ectopic PSA production has not been reported in trophoblastic tumors. Use of different calibrators may also cause slight differences between assays, but not to this degree.
33. Matrix effects:
a. Are most commonly seen with chemical assays for substances such as glucose, urea, and electrolytes
b. Are most commonly seen with tandem mass spectrometric methods
c. Can be prevented by using purified standards rather than calibrators for determining the relationship between concentration and machine response
d. Describes differences in measured concentration of a substance between samples of different composition that actually have the same concentration
e. Occur in most methods when aqueous controls are used to evaluate method performance
View Answer
33. d. Matrix effects are defined as differences in apparent concentration between samples with different composition (e.g., serum and urine). Matrix effects are common for substances that are poorly soluble in water (such as lipids) or in which there is a complex interaction between the sample and the reagents (such as enzyme assays and immunoassays). This creates problems in use of pure standards, which often have a very different matrix than serum samples. The solution to matrix effects is to use calibrators, solutions similar in composition to the samples being tested in which the concentration has been determined. Either calibrators or standards are used to prepare a standard (calibration) curve, in which the signal (e.g., amount of light absorbed) generated by the instrument on samples of known concentration is used to interpolate concentrations in unknown samples by measuring their generated signal in the assay.
34. The Beer-Lambert law (Beer’s law):
a. Applies only to pure solutions and cannot be used in biologic samples
b. Can be expressed by the formula A = abc, where A is absorbance, a is a constant for the compound, b is path length, and c is concentration
c. Describes the direct relationship between amount of light transmitted through a solution and the concentration of a substance present
d. Is used to determine the amount of current needed to produce adequate separation of compounds in an electrophoretic apparatus
e. Represents the relationship between number of drinks and blood alcohol concentration
View Answer
34. b. The Beer-Lambert law is the basis for photometric measurement, which is the underlying principle for most chemical assays. It describes a linear relationship between amount of light absorbed and the concentration of a compound in a solution. While biologic samples have a variety of other compounds within them, use of chemical reactions specific for the compound of interest allows use of this relationship in the clinical laboratory. Transmittance has an inverse relationship to absorbance (light that was not absorbed is transmitted through a solution), so there is an inverse relationship between transmittance and concentration.
35. In evaluating method performance, which of the following terms and corresponding method of determination is defined INCORRECTLY?
a. Carryover – running a low sample before and after a very high sample
b. Linearity – use of samples with known concentration and comparison of measured concentration to known concentration
c. Precision – multiple measurements of the same sample
d. Sensitivity – multiple measurements of the zero calibrator or standard
e. Within-run variation – comparison of results from the same sample over the course of 2 weeks, using the same calibrators
View Answer
35. e. Within-run variation is a measure of repeatability of results over a single set-up of an instrument, typically during the course of a single shift, when a single operator sets up the instrument and performs a group of tests. The description given would apply to betweenrun variation, which is generally a larger number.
36. Coefficient of variation:
a. Can be calculated by measuring samples from multiple persons used for reference range studies
b. Defines the variation observed in a person over a period of time
c. Is calculated as (standard deviation * 100)/mean value
d. Should typically be about 5% for serum sodium
e. Should typically be about 10% for serum glucose
View Answer
36. c. Coefficient of variation is a measure of the repeatability for a test, calculated as the percentage of the mean represented by the standard deviation of measurement. It is calculated by making multiple measurements of the same sample, either a control or a single patient. Coefficient of variation should be for electrolyte measurements, and in general is in the range of 2% to 5% for most tests. However, it may be as much as 10% for enzyme activity measurements, measurement of substances in very low concentrations, and for some immunoassays. For very complicated assays, it may be even higher. It is ideal that measurement variation be significantly lower than the variation within a person over time, so that changes in condition can be detected as changes in laboratory test results.
37. Comparing nephelometry and turbidimetry, which of the following statements is INCORRECT?
a. Both are most often used in the laboratory to measure antigen-antibody complexes to determine the amount of an antigen present.
b. Both are typically performed on large analyzers used for routine clinical chemistry testing.
c. In nephelometry, the detector is at an angle to the incident light.
d. In turbidimetry, the detector is in a straight line with the incident light.
e. Triglycerides are a major source of interference with both measurement principles.
View Answer
37. b. Turbidimetry and nephelometry are often used to measure the amounts of antigens (often proteins) that are present in concentrations of mg/dL or higher by measuring the number of antigen-antibody complexes present. The complexes form particles that prevent light from traveling in a straight line to a detector, instead causing the photons to be sent off at an angle to the incident light. This produces turbidity in a solution. Turbidimetry measures the decrease in light in the straight line path from the light source to the detector, while nephelometry places a detector at an angle to the incident light and measures the amount reaching the detector. Common applications are measurement of immunoglobulins, C-reactive protein, haptoglobin, and hemoglobin A1c. Anything else that causes turbidity in a sample, most commonly triglycerides, will interfere with measurement. Turbidimetry can be run using the same instrumental setup as spectrophotometry, which is used for most routine chemistry tests; nephelometry requires an instrument with a detector at an angle to the light source and is commonly done on dedicated instruments.
38. A patient with metastatic prostate cancer has an initial PSA measurement of 345.7 ng/mL. After his first course of chemotherapy, a repeat sample has a PSA result of 952 ng/mL. The oncologist questions the initial PSA result. When the initial sample is retrieved (it had been stored frozen) and run in dilution, the PSA result on the 1:10 dilution is 1157 ng/mL, yielding an apparent PSA concentration in the initial sample of 11,570 ng/mL. The second sample is also run in a 1:10 dilution, with a result of 96.3 ng/mL. What is the most likely explanation for the initial result on the first sample?
a. A high-dose hook effect was present, causing falsely low formation of antigen-antibody complexes in the presence of very large amounts of antigen.
b. An inhibitor of PSA’s enzymatic activity was present, but was removed by dilution.
c. Heterophile antibodies were present in the initial sample, causing falsely low results, but the antibody was removed by sample dilution.
d. The high enzymatic activity of PSA caused substrate depletion, which resulted in a falsely low activity measurement.
e. The technologist performing the initial run mixedup the samples, and ran the wrong patient.
View Answer
38. a. High-dose hook effect is seen in immunometric assays for substances that have very large ranges of concentration, most commonly tumor markers. When the range of assay concentration seen in samples exceeds 4-5 logs (for PSA, from <0.05 to over 5000, for example), there is the possibility of such an effect occurring. Since what is measured in immunometric assays is the number of antigen-antibody complexes, and this decreases with great antigen excess, a falsely low concentration results. Such samples can have extremely low apparent concentrations when the result is 6-7 logs above the usual measured concentration (e.g., for hCG measurements). PSA is not measured by its enzymatic activity, so those choices could not be correct. Heterophile antibodies typically cause falsely increased results, and would not be expected to disappear in the short period of time between diagnosis and first round of chemotherapy. While sample mix-up is always a possibility, it would be unusual to have another patient with the very high PSA value seen in the initial result.
39. Which scenario is LEAST helpful in determining that a sample being tested for prostate specific antigen (PSA) is falsely elevated due to the presence of human anti-mouse antibodies (HAMA)?
a. A 1:2 sample dilution gives linear and proportional PSA results.
b. The PSA results from the sample are 10 times above the upper reference limit when using one method and not detectable when using another method.
c. The use of an antibody blocking agent gives an undetectable PSA result on a sample that was previously elevated without the blocking agent.
d. The sample is positive for interference using a PSA HAMA specific immunoassay.
e. Medical records consistently indicate the patient’s PSA is elevated due to HAMA.
View Answer
39. a. Some reports indicate that as many as 50% of HAMAs are likely to dilute linearly. Therefore, the lack of proportional results with dilution provides useful information. However, proportional results alone are uninformative. Single dilutions should not be used to make decisions regarding the presence or absence of a heterophilic antibody. A more robust determination would consider a multipronged approach using blocking agents, measuring specifically for HAMA, and assaying the sample on more than one analytical platforms that use different antibodies.
40. Which instrumentation principle or use is INCORRECTLY described?
a. Nephelometry is used to measure large particle concentrations.
b. The principle of freezing point osmometry is related to the heat of fusion.
c. Crystal scintillation is primarily used to detect beta radiation using sodium iodide crystals that contain thallium.
d. Nuclear magnetic resonance spectroscopy is a technique for determining inorganic compound structures in a process that, like mass spectroscopy, destroys the compound.
e. Capillary electrophoresis is a separation technique using a high voltage and electro-osmotic flow to move excess positive ions toward the cathode.
View Answer
40. d. NMR determines structures of organic compounds and, unlike MS, is not destructive. The other statements correctly describe each corresponding instrumentation principle.
41. Which of the following statements about electrochemistry is FALSE?
a. An ideal reference electrode should exhibit a potential that is constant with time.
b. The calomel electrode makes use of sodium bicarbonate buffer and a gas-permeable membrane.
c. The pH electrode is a glass electrode that measures hydrogen ion activity.
d. The ion-selective electrode is an electrochemical transducer capable of responding to one specific ion.
e. The polypropylene membrane is often associated with the PO2 electrode and is effective in preventing blood constituents other than oxygen from passing through.
View Answer
41. b. The PCO2 electrode uses sodium bicarbonate buffer and a gas-permeable membrane. The calomel electrode is made of mercury that is in contact with a mercury (I) chloride-saturated solution. This solution is referred to as “calomel” and contains a known concentration of potassium chloride. The other choices correctly describe each of the corresponding electrodes.
42. The phenomenon of electroendosmosis:
a. Describes the faster migration of substances when increased osmotic activity buffers are used.
b. Is the cause for the more anodal migration of immunoglobulins in serum protein electrophoresis.
c. Is caused by hydronium ions in solvents, attracted to the negative charge on the electrophoretic medium, moving toward the negatively charged pole in the system.
d. Occurs with all types of electrophoretic media.
e. Should be prevented by use of low osmotic activity solutes and nonaqueous buffer solutions to avoid artifacts of separation.
View Answer
42. c. Electroendosmosis describes the paradoxical migration of charged molecules (such as immunoglobulins) in a direction contrary to what would be expected. When support media with a negative surface charge (such as cellulose acetate or agarose) are used, hydronium ions (as H3O+) are attracted to the surface and migrate toward the cathode (negatively charged) pole. The weak negative charge on proteins such as immunoglobulins causes them to be carried along with the solvent toward the cathode, instead of the expected migration toward the anode. Electroendosmosis does not occur with uncharged support media such as polyacrylamide gel or starch gel. It improves separation of proteins, and thus is helpful in analysis of serum proteins.
43. When proteins are denatured (such as by sodium dodecyl sulfate), polyacrylamide gel primarily separates them on the basis of:
a. Charge
b. Charge density
c. Degree of folding
d. Molecular length
e. Molecular weight
View Answer
43. e. SDS-PAGE separates the denatured proteins primarily on the basis of molecular weight. Charge density is the most important factor in electrophoresis with nondenatured proteins. Degree of folding is irrelevant when proteins are denatured.
44. In agarose gel electrophoresis, all of the following are important in affecting the separation of substances EXCEPT:
a. Ionic strength of the buffer
b. pH of the buffer
c. Temperature of the system
d. Time of electrophoresis
e. Voltage applied to the gel
View Answer
44. c. Temperature does not directly affect separation of compounds in electrophoresis; however, cooling is often used to prevent protein denaturation, which may affect migration of proteins. All of the other variables can be adjusted to improve separation of compounds in electrophoresis.
45. Which of the following is NOT a feature or benefit of point-of-care testing (POCT)?
a. Improved turnaround time for laboratory results
b. Less traumatic and less blood (for fingerstick systems)
c. Decreased manpower requirements in the central laboratory
d. Ease of use for serum or plasma
e. Built-in quality control systems
View Answer
45. d. Whole blood would have to be centrifuged to assay serum or plasma. Centrifugation is not a feature consistent with the use of point-of-care testing devices. Sampling volumes are often smaller and are less traumatic for the patient, and built-in quality control checks lend to the ease of use.
46. Which of the following is NOT a synonym or alternate name meaning point-of-care testing?
a. Ancillary testing
b. Decentralized testing
c. Distributed testing
d. Platform testing
View Answer
46. d. Testing done on an analytical platform or bench-top analyzer would likely be a test performed in the main laboratory and would therefore not be a point-of-care test.
47. Which statement LEAST describes point-of-care testing (POCT)?
a. The driving forces behind the use of POCT differ distinctly depending on the setting.
b. A significant potential benefit of POCT in the hospital setting is more rapid and (ideally) more effective assessment and management of critically ill patients.
c. POCT analyzers have less disposables and lower reagent costs than traditional laboratory systems and are therefore less expensive to operate.
d. The use of POCT systems is subject to regulations associated with the clinical laboratory testing.
e. Ultimate responsibility and control of POCT reside within an accreditation agency and require at least one laboratorian to be responsible for each POC program.
View Answer
47. c. POCT analyzers generate more disposables, and reagent costs are usually more expensive than traditional laboratory systems. One of the main drawbacks of POCT systems is the expensive price.
48. Which statement regarding clinical enzymology is FALSE?
a. Enzyme reactions generally proceed at zero order kinetics immediately following the lag phase.
b. When plotting a Lineweaver-Burk plot of a Michaelis-Menten enzyme in the presence of a competitive inhibitor, the value for 1/Vmax is constant for different concentrations of inhibitor.
c. In uncompetitive inhibition, the inhibitor binds only to the free enzyme and not to the enzyme-substrate complex.
d. ATP can serve as the rate-limiting step for coupled enzyme reactions.
e. When plotting a Lineweaver-Burk plot of a Michaelis-Menten enzyme in the presence of a noncompetitive inhibitor, lines of different slope correspond to different values of inhibitor concentration.
View Answer
48. c. In classic noncompetitive inhibition, the inhibitor binds only to the free enzyme and not to the enzyme-substrate complex. In uncompetitive inhibition, the inhibitor binds only to the enzyme-substrate complex and not to the free enzyme. Therefore, no enzymeinhibitor complex will form, and binding of the substrate will lead to a conformational change that will create an inhibitor binding site.
49. Which of the following statements regarding a specific enzyme is FALSE?
a. Acid phosphatase in serum is generally stable at all temperatures as long as the pH is above 7.
b. Lactate dehydrogenase is an example of an enzyme whose presence in plasma may indicate cellular damage.
c. The reference range for alkaline phosphatase is generally higher for children than it is for adults.
d. Alcohol dehydrogenase levels in the gastric mucosa of males are generally higher than in females.
e. Patients who have been at complete bed rest for several days generally have significantly lower values for creatine kinase.
View Answer
49. a. Acid phosphatase is unstable at all temperatures unless the pH of the serum is reduced to between 5 and 6.
50. Which of the following enzymes has the LOWEST red cell:serum activity ratio?
a. Aspartate transaminase
b. Alanine aminotransferase
c. Lactate dehydrogenase
d. Creatine kinase
View Answer
50. d. Red cells do not contain creatine kinase. The highest ratio would be seen with lactate dehydrogenase (around 500:1). The ratio of AST is about 15:1, while that of ALT is about 7:1.
51. Which of the following cholinesterase statements is FALSE?
a. Pseudocholinesterase can be used to monitor exposure to cholinesterase inhibitors.
b. Organophosphate insecticides are irreversible inhibitors of both pseudocholinesterase and acetylcholinesterase.
c. Pseudocholinesterase measurement can provide a good assessment of liver injury.
d. Acetylcholinesterase can be identified in amniotic fluid from pregnancies with neural tube defects.
e. Pseudocholinesterase testing can be used to recognize genetic variants in individuals demonstrating apnea during succinyl choline administration.
View Answer
51. c. In contrast to other hepatocyte enzymes, pseudocholinesterase production by the liver reflects hepatic synthetic function rather than hepatocyte injury.
52. A 34-year-old who is taking prescribed oxycodone for pain has a positive drug screen for opiate and
methadone. The confirmatory test is performed by a reference laboratory via gas chromatography mass spectrometry. This confirmatory test for opiates is positive for oxycodone, hydromorphone, and hydrocodone only (negative for methadone). The clinician taking care of the patient is concerned about possible interferences with the positive results and calls the laboratory to ask if the patient is taking other narcotics besides the prescribed OxyContin. Which of the following would be an INCORRECT statement about this case?
methadone. The confirmatory test is performed by a reference laboratory via gas chromatography mass spectrometry. This confirmatory test for opiates is positive for oxycodone, hydromorphone, and hydrocodone only (negative for methadone). The clinician taking care of the patient is concerned about possible interferences with the positive results and calls the laboratory to ask if the patient is taking other narcotics besides the prescribed OxyContin. Which of the following would be an INCORRECT statement about this case?
a. It is possible that methadone is not reported on the confirmation test because the scanning ion monitoring method is used, and a separate method may be used for methadone confirmation.
b. Methadone is likely the cause of the positive test result and is not likely interfering.
c. Hydrocodone and hydromorphone are metabolites of oxycodone.
d. Hydrocodone and hydromorphone are not likely to interfere with the methadone assay.
e. The patient is taking another drug besides oxycodone.
View Answer
52. c. Very little interferes with screening tests for methadone. It is possible that methadone does not show up on confirmation because of the specific method used in the laboratory. Also, many reference laboratories such as the Mayo Clinic identify methadone separately, and it is not part of their screen to confirm opiates. Hydrocodone and hydromorphone are not metabolites nor do they interfere with methadone or oxycodone detection. Because both were found on gas chromatography mass spectrometry confirmation, a third drug is indicated. Methadone is likely the cause of the positive test result.
53. An 18-year-old man was admitted with multiple broken bones, a punctured lung, and a ruptured spleen after an automobile accident. He was driving the car. A passenger in his car was also admitted to the emergency room; however, he died from multiple injuries shortly after admission. The police are waiting for the driver to recover because their intent is to arrest him for manslaughter for being under the influence of alcohol and drugs at the time of the accident. A serum alcohol obtained at the time of admission was 11 mg/dL (110 mg/L), and a urine drug screen was positive for cannabinoids. Of the following, the best statement that can be made about the driver is that he is:
a. Under the influence of alcohol and marijuana
b. Under the influence of alcohol but not marijuana
c. Under the influence of marijuana but not alcohol
d. Under the influence of neither alcohol nor marijuana
e. None of the above
View Answer
53. e. The legal limit for alcohol is 80 mg/dL (equivalent to “blowing” a 0.08 on a breathalyzer). Additionally, only whole blood (not serum) analyzed by head space gas chromatography from a chain-of-custody sample can be used to define a legal/forensic alcohol level. The driver’s measured level of 11 mg/dL (equivalent to blowing a 0.011) does not indicate impairment. Impairment is reported to begin at 40 mg/dL. Blood alcohol levels between 0.02 and 0.03 are associated with slight euphoria and loss of shyness but are not usually associated with loss of coordination. Depressant effects are not apparent at these levels. The presence of marijuana indicates past exposure and does not prove that an individual is under the influence of the drug. Urine immunoassays are screening tests, not confirmatory tests.
54. Which of the choices listed is the best method for collecting and storing a sample for forensic analysis to determine the possibility of ethanol and cocaine use? Assume proper chain of custody procedures is followed.
a. Whole blood collected in a red-top tube (no preservative) and refrigerated (4°C) for 2 months
b. Adipose tissue immediately fixed in formalin
c. Whole blood collected in a grey-top tube (NaF) at the time of death and frozen for 2 months
d. Whole blood collected in a red-top tube and stored at room temperature for 3 days
e. Serum or plasma that is immediately separated and frozen at the time of autopsy
View Answer
54. c. NaF is preferred for collecting samples from individuals who are suspected of cocaine use. Cocaine is metabolized by hydrolysis of ester linkages. In blood, cocaine is hydrolyzed to ecgonine methyl ester via cholinesterase. This reaction is dependent on the concentration of cocaine and may be inhibited by freezing or addition of fluoride or cholinesterase inhibitors. At 4°C 1 mg/L of cocaine will loose 100% of the parent drug after 21 days.
55. Which of the following pharmacokinetic parameters is defined as the amount of an administered dose that gains entry into the systemic circulation?
a. Dose
b. Bioavailability
c. Volume of distribution
d. Clearance
e. Steady state
View Answer
55. b. The dose is the amount of drug given. Bioavailability is the amount of an administered dose that enters the systemic circulation. The bioavailability of an intravenous dose is generally 100%. Volume of distribution is the apparent volume into which the administered drug has distributed. Clearance is the amount of serum completely cleared of drug in a unit of time (e.g., mL/min or L/hr). Steady state is achieved when the net rate of drug input is exactly matched by the rate of elimination. The rate going in equals the rate going out. The rate going out equals clearance. Steady state is the level achieved and maintained in the therapeutic range.
56. Which of the following drugs of abuse could be classified best as a tranquilizer?
a. Morphine
b. Diazepam
c. Phenobarbital
d. Cocaine
e. Phencyclidine
View Answer
56. b. Diazepam (Valium) is a tranquilizer. Morphine is an opiate. Phenobarbital is a barbiturate. Cocaine is a stimulant (dopaminergic pathway). Phencyclidine is a hallucinogen.
57. Which statement regarding a specific cardiotropic agent is INCORRECT?
a. Toxic effects of procainamide can include reversible lupus erythematous-like syndrome.
b. Digoxin slows AV node conduction.
c. Lidocaine is highly protein bound and therefore has a relatively long half-life compared with other cardiotropic agents.
d. Digoxin is an active metabolite of digitoxin.
e. Amiodarone functions mainly by blocking potassium channels in cardiac muscle.
View Answer
57. c. Lidocaine is neither highly bound to protein nor is it appreciably stored in tissue. It has a relatively short half-life of about 2 hours. The other statements correctly state a function of the indicated cardiotropic agent.
58. Which of the following drugs can be monitored by inference through the measurement of caffeine?
a. Acetylsalicylic acid
b. Valproic acid
c. Carbamazepine
d. Primidone
e. Theophylline
View Answer
58. e. About 90% of theophylline is metabolized by the liver, with caffeine being one of the major metabolites in children. In adults, caffeine is argued to be undetectable with theophylline use.
59. Which of the following systemic effects (therapeutic or adverse) is matched INCORRECTLY for an opioid action?
a. Nervous – Euphoria
b. Pulmonary – Respiratory depression
c. Gastrointestinal – Constipation
d. Cardiac – Tachycardia
e. Endocrine – Increased ADH secretion
View Answer
59. d. Opioids are associated with feelings of euphoria that are often accompanied by respiratory depression and bradycardia. Constipation and increased ADH secretion are other common associations with opioid ingestion.
60. Which of the following compounds is most appropriate to detect cocaine use in a sweat sample?
a. Cocaine
b. Ecgonine methyl ester
c. Norcocaine
d. Benzoylecgonine
e. Ecgonine
View Answer
60. a. In sweat, cocaine is primarily excreted as the parent drug. This offers an added advantage of simple gas chromatography analysis.
61. Which of the following elements is INCORRECTLY matched with the corresponding toxicity description?
a. Aluminum – Proper kidney function plays a significant role in aluminum levels, returning to normal once exposure has ended.
b. Arsenic – Elemental arsenic (As°) is quite toxic.
c. Iron – Iron toxicity can include hepatic necrosis.
d. Lithium – Lithium toxicity can be associated with thyroid enlargement.
e. Lead – Lead toxicity often leads to inhibition of the ferrochelatase enzyme converting protoporphyrin IX to Heme.
View Answer
61. b. Aluminum phosphide is a grain fumigant that has been orally ingested in both suicides and accidents. Blood levels of aluminum rise during exposure and subsequently return to normal, unless kidney function is impaired. In increasing levels of toxicity, common forms of arsenic exist as arsenate (As+5), arsenite (As+3), and arsine (AsH3) gas. Elemental arsenic is relatively not toxic. Effects of excess iron ingestion can include hepatic necrosis after 4 days and has also been associated with GI obstruction after 4 weeks. Patients taking Li2CO3 for manic-depressive disorders sometimes develop thyroid enlargement. Lead toxicity leads to inhibition of several mitochondrial enzymes in heme synthesis; ferrochelatase is directly affected.
62. Which of the following is NOT an ADH-deficient cause of polyuria due to water diuresis?
a. Central diabetes insipidus
b. Dipsogenic diabetes insipidus (excessive water intake)
c. Gestational diabetes insipidus (excessive vasopressinase)
d. Pituitary or hypothalamic infection
e. ADH receptor mutation causing congenital nephrogenic diabetes insipidus
View Answer
62. e. Choices A-D all describe ADH-deficient causes of polyuria due to water diuresis. Choice E is not related to this pathogenesis.
63. Which of the following neuroendocrine tumors would most likely be associated with gallstones, diabetes, diarrhea, and hypochlorhydria?
a. Carcinoid
b. Gastrinoma
c. Insulinoma
d. VIPomas
e. Somatostatinoma
View Answer
63. e. Somatostatin inhibits a number of intestinal and pancreatic hormones. It causes diabetes through inhibition of insulin and hypochlorhydria due to inhibition of gastrin. Diarrhea is at least partially due to inhibition of pancreatic enzyme production, and gallstones may be due to inhibition of CCK production. While diarrhea can be seen with carcinoid and gastrinoma, the other findings are rare, while insulinomas only cause hypoglycemia and none of the other manifestations.
64. Which of the following assays generates the highest sensitivity for diagnosing a pheochromocytoma?
a. Plasma-free metanephrines
b. Plasma catecholamines
c. Urine catecholamines
d. Urine total metanephrines
e. Urine vanillylmandelic acid
View Answer
64. a. Measurement of plasma-free metanephrines is between 97% and 99% sensitive for diagnosing hereditary and sporadic pheochromocytomas and has the highest sensitivity among the choices listed for diagnosing a pheochromocytoma; however, specificity is relatively low (85%). Specificity is highest for measurement of fractionated metanephrines or catecholamines in urine.
65. Which of the following disorders is associated with increased renin levels?
a. Cushing syndrome
b. Liddle syndrome
c. Addison disease
d. Primary hyperaldosteronism
e. Dexamethasone-suppressible hyperaldosteronism
View Answer
65. c. Addison disease is associated with elevated levels of renin. Primary hyperaldosteronism and Cushing and Liddle syndromes are conditions associated with decreased renin levels. Additionally, decreased renin levels are associated with dexamethasone-suppressible hyperaldosteronism.
66. Which of the following causes of congenital adrenal hyperplasia is most likely to result in increased levels of 11-deoxycortisol?
a. 21-hydroxylase deficiency
b. 11 beta-hydroxylase deficiency
c. 3 beta-hydroxylase deficiency
d. 3 beta-hydroxysteroid dehydrogenase deficiency
e. 17 alpha-hydroxylase deficiency
View Answer
66. b. 11 beta-hydroxylase converts 11-deoxycortisol to cortisol in the glucocorticoid pathway (zona fasciculata) in the adrenal cortex. Congenital adrenal hyperplasia (CAH) associated with elevated levels of 11-deoxycortisol will likely be caused by a deficiency in 11 beta-hydroxylase. This enzyme defect represents approximately 5% of all cases of CAH, while 21-hydroxylase deficiency represents almost all of the remaining 95% of CAH cases. Much rarer causes include deficiencies of enzymes further “upstream” in the glucocorticoid and mineralocorticoid cascade.
67. A 24-hour urine sample was submitted to the laboratory from a 32-year-old man who is being evaluated for a possible pheochromocytoma. The catecholamines that were ordered were determined to be 145 µg/day (reference range = 90-150 µg/day). The printout indicated that the creatinine was 0.5 g/day. Which of the following is most appropriate for the technician to take?
a. Check the urine pH to verify that it has been acidified correctly (pH < 2).
b. Report the catecholamines as grams of creatinine.
c. Measure metanephrines and cancel the order for catecholamines.
d. Request a plasma sample to obtain corresponding plasma catecholamine levels.
e. Cancel the order and request a new 24-hour urine sample.
View Answer
67. e. A urine creatinine much less than 0.9 g/day likely means that the sample collection was incomplete. These values would lead to a misinterpreted catecholamine result.
Questions 68-72:
For these questions, use the following reference limits: Total T4, 4.5-12.5 mcg/dL, Total T3 80-220 ng/dL, Free T4 0.7-1.7 ng/dL, T3 uptake 22% to 33%, TSH 0.45-4.8 mIU/L, thyroglobulin 2.0-35 ng/mL. Anti-thyroglobulin and anti-thyroid peroxidase <1.0 relative units, thyroid-stimulating immunoglobulin 70% to 130%.
68. A 53-year-old woman is admitted with hypotension, fever, and abdominal pain and is found to have a perforated colon. Because of concerns for coexisting thyroid disease, a full panel of thyroid tests was ordered, including total T4 6.7 mcg/dL, total T3 45 ng/dL, T3 uptake 28%, and TSH 4.4 mIU/L. The surgeon is concerned and has called for your assistance in interpreting these results. The correct interpretation would be:
a. No interpretation is possible, since thyroid tests are always misleading in the setting of acute illness.
b. The high ratio of T4 to T3 suggests early hyperthyroidism, and could be due to a TSH-producing tumor, since TSH is not suppressed.
c. These results are typical for “euthyroid sick syndrome,” or nonthyroidal illness, and do not indicate underlying thyroid disease.
d. This patient likely has early hypothyroidism, and should have measurement of TPO antibodies.
e. This patient likely has a decreased level of thyroid binding proteins due to the surgery, which causes the observed results.
View Answer
68. c. The normal T4, T3 uptake, and TSH with low T3 are typical of “euthyroid sick syndrome,” or nonthyroidal illness. In acute illness, peripheral conversion of T4 to T3 (by the type I monodeiodinase) is impaired, while pituitary conversion of T4 to T3 (by the type 2 monodeiodinase) is normal, preventing an increase in TSH. Those who are acutely ill may actually have abnormal TSH due to the effects of a number of factors (cortisol, dopamine, cytokines) that impact TSH production, often making it hard to evaluate actual thyroid status in acute illness.
69. A 35-year-old woman complained of feeling tired, and so had thyroid function tests ordered. Results included total T4 14.3 mcg/dL, total T3 280 ng/dL, T3 uptake 18%, TSH 2.5 mIU/L. Her primary care physician asked for your input in interpreting these results. The correct interpretation would be:
a. A heterophile antibody is likely present, causing falsely increased T4 and T3 and falsely low T3 uptake.
b. These results are typical for euthyroid sick syndrome, or nonthyroidal illness, and do not indicate underlying thyroid disease.
c. These results indicate increased thyroid-binding proteins, most likely due to increased estrogenic effect; you are told the woman is taking oral contraceptives.
d. This patient is hyperthyroid and further testing is required to determine the cause.
e. This patient has hyperthyroidism that is likely due to a TSH-producing pituitary tumor.


