TABLE 6.1 Common Screening Profiles | ||||||||||||||||||
|---|---|---|---|---|---|---|---|---|---|---|---|---|---|---|---|---|---|---|
| ||||||||||||||||||
membrane permeability to glucose, transports glucose into cells (for metabolism), stimulates glycogen formation, and reduces blood glucose levels. Driving insulin into the cells requires insulin and insulin receptors. For example, after a meal, the pancreas releases insulin for glucose metabolism, provided there are enough insulin receptors. Insulin binds to these receptors on the surface of target cells such as are found in fat and muscle. This opens the channels so that glucose can pass into cells, where it can be converted into energy. As cellular glucose metabolism occurs, blood glucose levels fall. Adrenocorticotropic hormone (ACTH), adrenocorticosteroids, epinephrine, and thyroxine also play key roles in glucose metabolism.
TABLE 6.2 Standard Panels | ||||||||||||||||||||
|---|---|---|---|---|---|---|---|---|---|---|---|---|---|---|---|---|---|---|---|---|
|
Type 1 (formerly known as insulin-dependent diabetes mellitus or juvenile-onset diabetes mellitus), due to destruction of pancreatic β cells which leads to deficiency in insulin, accounts for about 5% to 10% of individuals diagnosed with diabetes.
Type 2 (formerly known as non-insulin-dependent diabetes mellitus or adult-onset diabetes mellitus), a progressive form of insulin deficiency concomitant with insulin resistance, accounts for 90% to 95% of individuals diagnosed with diabetes.
Due to other causes (e.g., genetic defects [see Chapter 11 for genetic causes]), disease of the pancrease, drug- or chemical-induced, etc.
Gestational (i.e., diagnosed during pregnancy)
The National Institutes of Health (NIH) guidelines endorse diabetic testing of all adults ≥45 years of age every 3 years. The ADA recommends the following guidelines for testing:
Should be considered if patient is >45 years of age
Strongly recommended if patient is >45 years of age and overweight
Considered if patient is <45 years of age and overweight with another risk factor
Diabetes mellitus, a group of metabolic disorders, is characterized by hyperglycemia and abnormal protein, fat, and carbohydrate metabolism due to defects in insulin secretions— that is, inadequate and deficient insulin action (insulin resistance) on target organs.
Criteria for diagnosing diabetes:
Symptoms of diabetes plus random/casual plasma glucose concentration of ≥200 mg/dL (≥11.1 mmol/L). Random/casual is defined as any time of day without regard to time since last meal. The classic symptoms of diabetes include polyuria, polydipsia, and unexplained weight loss, or
FPG ≥126 mg/dL (≥7.0 mmol/L) on at least two occasions (fasting is defined as no caloric intake for at least 8 hours), or
Two-hour PG ≥200 mg/dL (≥11.1 mmol/L) during an oral glucose tolerance test (OGTT). The test should be performed as described by the World Health Organization (WHO), using a glucose load containing the equivalent of 75 g anhydrous glucose dissolved in water.
Hemoglobin A1c ≥6.5% (48 mmol/mol). Method used for testing should be NGSP certified and standardized to DCCT assay.
(1) In the absence of unequivocal hyperglycemia with acute, metabolic decompensation, these criteria should be confirmed by repeat testing of b to d on a different day. OGTT is not recommended for routine clinical use.
Draw a 5-mL venous blood sample from a fasting person or a random plasma glucose (FPG) (any time of day). In known cases of diabetes, blood drawing should precede insulin or oral hypoglycemic administration. Observe standard precautions. Serum is acceptable if separated from red cells within an hour. A gray-topped tube, which contains sodium fluoride, is acceptable for 24 hours without separation.
Self-monitoring of blood glucose by the person (or clinician) with diabetes can be done by fingerstick blood drop sampling several times per day if necessary. Several devices are commercially available for this procedure; they are relatively easy to use and have been established as a major component in satisfactory diabetes control. Calibration of monitoring devices should be done on a regular basis.
Noninvasive methods using skin pads to check blood glucose level are being developed for self-monitoring that eliminate the dreaded finger-prick test, for example, a GlucoWatch (Cygnus, Redwood City, CA), worn on the wrist and powered by an AAA battery.
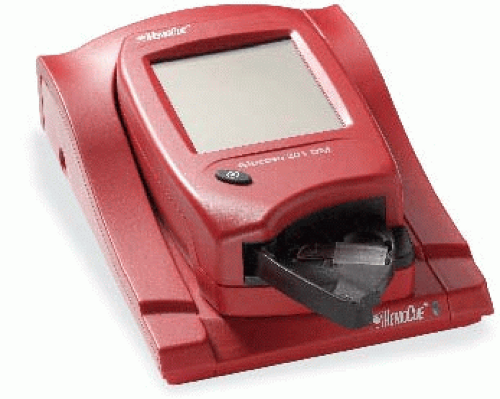 FIGURE 6.1. Portable blood glucose analyzer. (Reprinted with permission from HemoCue AB, Angelholm, Sweden.) |
General instructions
Make sure hands are clean, dry, and warm.
Prick finger with the lancet.
Squeeze out a drop of capillary blood.
Apply SECOND drop of blood onto the test strip or sensor.
Wait for the test strip or sensor to develop.
Compare the test strip to the chart or insert it in the meter.
Safely dispose of lancet in an approved sharps container.
Record blood glucose results with date and time.
If type 1 diabetes mellitus is present, also monitor urine for ketones or blood betahydroxybutyrate for possible dangerous complications such as diabetic ketoacidosis (e.g., during stress or acute illness).
Test more often on days when illness occurs, when blood glucose is too high, when meal or exercise plans change, when travelling, or if it is thought that the blood glucose is low.
If concerned about getting accurate results, consult with the diabetes educator or contact the manufacturer to ensure proper use of the monitor.
Several blood glucose meters currently available are approved by the U.S. Food and Drug Administration (FDA), the agency that approves medical devices, for what’s called “alternate site testing.”
Alternate sites (other than fingertips) include forearm, bicep area, palm of hand, between fingers, and sometimes the calf.
Tips for using alternate sites:
Rub the site to be used to check blood glucose vigorously before pricking skin. This increases blood flow to the site.
Use one type of monitor; do not alternate between different monitors. This will help to obtain consistent results.
Consistently use the same alternate site. For example, always use forearms. This will also help to obtain consistent results.
Elevated blood glucose (hyperglycemia) occurs in the following conditions:
Diabetes mellitus: a fasting glucose ≥126 mg/dL (>7.0 mmol/L) or a 2-hour postprandial load plasma glucose ≥200 mg/dL (>11.1 mmol/L) during an oral GTT.
Other conditions that produce elevated blood plasma glucose levels include the following:
Cushing’s disease (increased glucocorticoids cause elevated blood sugar levels)
Acute emotional or physical stress situations (e.g., myocardial infarction [MI], cerebrovascular accident, convulsions)
Pheochromocytoma, acromegaly, gigantism
Pituitary adenoma (increased secretion of growth hormone causes elevated blood glucose levels)
Hemochromatosis
Pancreatitis (acute and chronic), neoplasms of pancreas
Glucagonoma
Advanced liver disease
Chronic renal disease
Vitamin B deficiency: Wernicke’s encephalopathy
Pregnancy (may signal potential for onset of diabetes later in life)
Decreased blood plasma glucose (hypoglycemia) occurs in the following conditions:
Pancreatic islet cell carcinoma (insulinomas)
Extrapancreatic stomach tumors (carcinoma)
Addison’s disease (adrenal insufficiency), carcinoma of adrenal gland
Hypopituitarism, hypothyroidism, ACTH deficiency
Starvation, malabsorption (starvation does not cause hypoglycemia in normal persons)
Liver damage (alcoholism, chloroform poisoning, arsenic poisoning)
Premature infant; infant delivered to a mother with diabetes
Enzyme-deficiency diseases (e.g., galactosemia, inherited maple syrup urine disease, von Gierke’s syndrome)
Insulin overdose (accidental or deliberate)
Reactive hypoglycemia, including alimentary hyperinsulinism, prediabetes, endocrine deficiency
Postprandial hypoglycemia may occur after gastrointestinal (GI) surgery and is described with hereditary fructose intolerance, galactosemia, and leucine sensitivity.
According to the ADA criteria, there are three definitive tests for diabetes:
Symptoms of diabetes plus a random/casual plasma glucose ≥200 mg/dL (>11.1 mmol/L), or
An FPG ≥126 mg/dL (>6.99 mmol/L)*, or
An OGTT with a 2-hour postload (75-g glucose load) level ≥200 mg/dL (≥11.1 mmol/L),* or
Hemoglobin A1c ≥6.5%*
The classification of diabetes diagnosis reflects a shift to the etiology or pathology of the disease from a classification based on pharmacologic treatment.
Impaired fasting glucose (IFG) or impaired glucose tolerance (IGT) is referred to as prediabetes.
Elevated glucose:
Steroids, diuretics, other drugs (see Appendix E)
Pregnancy (a slight blood glucose elevation normally occurs)
Surgical procedures, anesthesia, and hospitalization in intensive care unit (ICU)
Obesity or sedentary lifestyle
Parenteral glucose administration (e.g., from total parenteral nutrition)
IV glucose (recent or current)
Heavy smoking
The DAWN phenomenon occurs in both non-insulin-dependent and insulin-dependent diabetes mellitus. There is an increase in blood glucose, typically between 4:00 a.m. and 8:00 a.m., due to counter-regulatory hormones, including growth hormone, cortisol, and glucagon.
Decreased glucose:
Hematocrit >55%
Intense exercise
Toxic doses of aspirin, salicylates, and acetaminophen
Other drugs (see Appendix E), including ethanol, quinine, and haloperidol
Explain test purpose (to detect hyperglycemia) and blood-drawing procedure. Note time.
Tell patient that the test requires at least an overnight fast; water is permitted. Instruct the patient to defer insulin or oral hypoglycemics until after blood is drawn, unless specifically instructed to do otherwise.
Note the last time the patient ate in the record and on the laboratory requisition.
Follow guidelines in Chapter 1 for safe, effective, informed pretest care.
Tell the patient that he or she may eat and drink after fasting blood is drawn. Note time.
Interpret test results and monitor appropriately for hyperglycemia and hypoglycemia. Counsel regarding necessary lifestyle changes (e.g., diet, exercise, glycemic control, and medication). Target blood glucose levels: before meals or upon waking, 80-120 mg/dL (4.4-6.6 mmol/L); at bedtime, 100-140 mg/dL (5.5-7.7 mmol/L).
Pharmacologic intervention may include pioglitazone (targets insulin resistance) plus glimepiride (increases amount of insulin) to improve glycemic control in type 2 diabetes.
Treatment regimens:
Initial medical treatment includes use of metformin. The addition of other glucose lowering medications may be necessary.
When target goals are not achieved and glucose and A1c remain elevated, early (basal) insulin therapy may be indicated.
In hospitalized patients (ICU, surgery, critical illnesses), strict glycemic controls, interventions (blood checking at least four times daily and sliding scale insulin administration), and aggressive insulin therapy are indicated.
Glucose may be monitored by three methods: (1) intermittent laboratory analysis, (2) bedside monitor, and (3) continuous glucose monitoring. The continuous glucose monitor system has been used to safely lower blood sugar in children with type 1 diabetes. In this instance, a tiny glucose-sensing device is inserted under the skin of the abdomen. This sensor and computer (attached to a belt) measure and record blood glucose every 10 seconds for 3 days.
Give the patient the following checklist:
Take special care of feet.
Use a lubricant or unscented hand cream on dry, scaly skin.
Look for calluses on soles. Rub them gently with a pumice stone.
Make sure new shoes fit properly; wear freshly washed socks or stockings.
Never go barefoot.
Avoid using hot water bottles, tubs of hot water, or heating pads on your feet.
Trim toenails straight across.
Make sure doctor inspects feet as part of every visit.
Use a team approach to help make decisions about care. The team may include a doctor, a nurse diabetes educator, a dietitian, a pharmacist, and family.
Use other health professionals to help with care. These may include an eye doctor (ophthalmologist or optometrist), an exercise physiologist, a podiatrist (a foot specialist), and a psychologist.
Follow the most healthful lifestyle possible.
Persons with glucose levels >200 mg/dL (>11.1 mmol/L) should be placed on a strict intake and output program.
In-home test kits are available for patients to evaluate whether they have lost protective sensation in a foot, which would put them at high risk for lower extremity amputation. The lower extremity amputation prevention (LEAP) monofilament test includes a 10 g reusable monofilament that is touched to eight sites on each foot for 1 to 2 seconds. A diagram of each foot with the sites marked is included in the kit for recording whether sensation was felt at each site. The results can then be reviewed by the health care provider and further evaluation undertaken if indicated.
Follow guidelines in Chapter 1 for safe, effective, informed posttest care.
If a person with known or suspected diabetes experiences headaches, irritability, dizziness, weakness, fainting, or impaired cognition, a blood glucose test or finger-stick test must be done before giving insulin. Similar symptoms may be present for both hypoglycemia and hyperglycemia. If a blood glucose level cannot be obtained and one is uncertain regarding the situation, glucose may be given in the form of orange juice, sugar-containing soda, or candy (e.g., hard candy or jelly beans). Make certain the person is sufficiently conscious to manage eating or swallowing. In the acute care setting, IV glucose may be given in the event of severe hypoglycemia. A glucose gel is also commercially available and may be rubbed on the inside of the mouth by another person if the person with diabetes is unable to swallow or to respond properly. Instruct persons prone to hypoglycemia to carry sugar-type items on their person and to wear a necklace or bracelet that identifies the person as diabetic.
Frequent blood glucose monitoring, including self-monitoring, allows better control and management of diabetes than urine glucose monitoring.
When blood glucose values are >300 mg/dL (>16.6 mmol/L), urine output increases, as does the risk for dehydration.
Diabetes is a “disease of the moment”: persons living with diabetes are continually affected by fluctuations in blood glucose levels and must learn to manage and adapt their lifestyle within this framework. For some, adaptation is relatively straightforward; for others, especially those identified as being “brittle,” lifestyle changes and management are more complicated, and these patients require constant vigilance, attention, encouragement, and support.
Each person with diabetes may experience certain symptoms in his or her own unique way and in a unique pattern.
Infants with tremor, convulsion, or respiratory distress should have STAT glucose done, particularly in the presence of maternal diabetes or with hemolytic disease of the newborn.
Newborns who are too small or too large for gestational age should have glucose level measured in the first day of life.
Diseases related to neonatal hypoglycemia:
Glycogen storage diseases
Galactosemia
Hereditary fructose intolerance
Ketogenic hypoglycemia of infancy
Carnitine deficiency (Reye’s syndrome)
G-HB: >10.1% (>0.101)
A1c: >8.1% (>0.08) corresponds to an estimated average glucose >186 mg/dL (>10.3 mmol/L)
Obtain a 5-mL venous blood sample with EDTA purple-topped anticoagulant additive. Serum may not be used.
Observe standard precautions. Place specimen in a biohazard bag.
Values are frequently increased in persons with poorly controlled or newly diagnosed diabetes.
With optimal control, the HbA1c moves toward normal levels.
A diabetic patient who recently comes under good control may still show higher concentrations of glycosylated hemoglobin. This level declines gradually over several months as nearly normal glycosylated hemoglobin replaces older RBCs with higher concentrations.
Increases in glycosylated hemoglobin occur in the following nondiabetic conditions:
Iron-deficiency anemia
Splenectomy
Alcohol toxicity
Lead toxicity
Decreases in A1c occur in the following nondiabetic conditions:
Hemolytic anemia
Chronic blood loss
Pregnancy
Chronic renal failure
Presence of Hb F and H causes falsely elevated values.
Presence of Hb S, C, E, D, G, and Lepore (autosomal recessive mutation resulting in a hemoglobinopathy) causes falsely decreased values.
Explain test purpose and blood-drawing procedure. Observe standard precautions. Fasting is not required.
Note that this test is not meant for short-term diabetes mellitus management; instead, it assesses the efficacy of long-term management modalities over several weeks or months. It is not useful more often than 4 to 6 weeks.
Follow guidelines in Chapter 1 for safe, effective, informed pretest care.
Interpret test outcome, with target A1c of <5.7%, and counsel patient appropriately for management of diabetes with oral hypoglycemics and insulin. If test results are not consistent with clinical findings, check the patient for Hb F, which elevates HbA1c results.
Follow guidelines in Chapter 1 regarding safe, effective, informed posttest care.
Two-step approach:
Perform initial screening by measuring plasma or serum glucose 1 hour after a 50-g load of 140 mg/dL identifies 80% of women with GDM, while the sensitivity is further increased to 90% by a threshold of 130 mg/dL.
Perform a diagnostic 100-g OGTT on a separate day in women who exceed the chosen threshold on 50-g screening.
One-step approach (may be preferred in clinics with high prevalence of GDM): Perform a diagnostic 100-g OGTT in all women to be tested at 24 to 28 weeks. The 100-g OGTT should be performed in the morning after an overnight fast of at least 8 hours.
Fasting plasma glucose >95 mg/dL (>5.3 mmol/L)
1 hour >180 mg/dL (>10.0 mmol/L)
2 hour >155 mg/dL (>8.6 mmol/L)
3 hour >140 mg/dL (>7.8 mmol/L)
Draw a 5-mL venous blood sample (sodium fluoride) after an 8- to 14-hour fast, at least 3 days of unrestricted diet and activity, and after glucose load.
Observe standard precautions. Place specimen in a biohazard bag.
A positive result in a pregnant woman means she is at much greater risk (seven times) for having GDM.
GDM is any degree of glucose intolerance with onset during pregnancy or first recognized during pregnancy.
Explain test purpose (to evaluate abnormal carbohydrate metabolism and predict diabetes in later life) and procedure. No fasting is usually required. Obtain pertinent history of diabetes and record any signs or symptoms of diabetes.
Instruct the woman about obtaining a urine sample for glucose testing to check before drinking the glucose load. Positive urine glucose should be checked with the physician before glucose
load. Those with glycosuria >250 mg/dL (>13.8 mmol/L) must have a blood glucose test before GDM testing.
Give the patient the appropriate glucose beverage (150 mL dissolved in water or Trutol or Orange DEX).
Explain to the patient that no eating, drinking, smoking, or gum chewing is allowed during the test. The patient should not leave the office. She may void if necessary.
After 1 hour, draw one NaF or EDTA tube (5-mL venous blood) using standard venipuncture technique.
Normal activities, eating, and drinking may be resumed.
Interpret test results and explain to patient what to expect for a normal outcome.
Six to 12 weeks after delivery, the patient should be retested and reclassified. In most cases, glucose will return to normal.
Family history of diabetes
Obesity
Unexplained episodes of hypoglycemia
History of recurrent infections (boils and abscesses)
In women, history of delivery of large infants, stillbirths, neonatal death, premature labor, and spontaneous abortions
Transitory glycosuria or hyperglycemia during pregnancy, surgery, trauma, stress, MI, and ACTH administration
Have patient eat a diet with >150 g of carbohydrates for 3 days before the test.
Ensure that the following drugs are discontinued 3 days before the test because they may influence test results:
Hormones, oral contraceptives, steroids
Salicylates, anti-inflammatory drugs
Diuretic agents
Hypoglycemic agents
Antihypertensive drugs
Anticonvulsants (see Appendix E)
Insulin and oral hypoglycemics should be withheld until the test is completed.
Record the patient’s weight.
Pediatric doses of glucose are based on body weight, calculated as 1.75 g/kg not to exceed a total of 75 g.
Nonpregnant adults: 75 g glucose
A 5-mL sample of venous blood is drawn. Serum or gray-topped tubes are used. The patient should fast 12 to 16 hours before testing. After the blood is drawn, the patient drinks all of a specially formulated glucose solution within a 5-minute time frame.
Blood samples are obtained at fasting and 2 hours after glucose ingestion.
Tolerance tests can also be performed for pentose, lactose, galactose, and D-xylose.
The GTT is not indicated in these situations:
Persistent fasting hyperglycemia >140 mg/dL or >7.8 mmol/L
Persistent fasting normal plasma glucose
Patients with overt diabetes mellitus
Persistent 2-hour plasma glucose >200 mg/dL or >11.1 mmol/L
 PROCEDURAL ALERT
GTT is contraindicated in patients with a recent history of surgery, MI, or labor and delivery— these conditions can produce invalid values.
The GTT should be postponed if the patient becomes ill, even with common illnesses such as the flu or a severe cold.
Record and report any reactions during the test. Weakness, faintness, and sweating may occur between the second and third hours of the test. If this occurs, a blood sample for a glucose level should be drawn immediately and the GTT aborted.
Should the patient vomit the glucose solution, the test is declared invalid; it can be repeated in 3 days (about 72 hours).
The presence of abnormal GTT values (decreased tolerance to glucose) is based on the International Classification for Diabetes Mellitus and the following glucose intolerance categories:
At least two GTT values must be abnormal for a diagnosis of diabetes mellitus to be validated.
In cases of overt diabetes, no insulin is secreted; abnormally high glucose levels persist throughout the test.
Glucose values that fall above normal values but below the diagnostic criteria for diabetes or impaired glucose tolerance (IGT) should be considered nondiagnostic.
TABLE 6.3 Glucose Tolerance Test (GTT) Levels
Conventional Units (mg/dL)
SI Units (mmol/L)
Fasting adult
140
7.8
Adult diabetes mellitus 1-h glucose
>200
>11.1
and 2-h glucose
>200
>11.1
Fasting adult
140
7.8
Adult impaired glucose tolerance 1-h glucose
>200
>11.1
and 2-h glucose
>140-200
>7.8-11.1
Juvenile diabetes mellitus (fasting glucose)
>140
>7.8
and 1-h glucose
>200
>11.1
and 2-h glucose
>200
>11.1
Impaired glucose tolerance in children (fasting glucose)
and 2-h glucose
>140
>7.8
See Table 6.3 for an interpretation of glucose tolerance levels.
Decreased glucose tolerance occurs with high glucose values in the following conditions:
Diabetes mellitus
Postgastrectomy
Hyperthyroidism
Excess glucose ingestion
Hyperlipidemia types III, IV, and V
Hemochromatosis
Cushing’s disease (steroid effect)
Central nervous system (CNS) lesions
Pheochromocytoma
Decreased glucose tolerance with hypoglycemia can be found in persons with von Gierke’s disease, severe liver damage, or increased epinephrine levels.
Increased glucose tolerance with flat curve (i.e., glucose does not increase but may decrease to hypoglycemic levels) occurs in the following conditions:
Pancreatic islet cell hyperplasia or tumor
Poor intestinal absorption caused by diseases such as sprue, celiac disease, or Whipple’s disease
Hypoparathyroidism
Addison’s disease
Liver disease
Hypopituitarism, hypothyroidism
Smoking increases glucose levels.
Altered diets (e.g., weight reduction) before testing can diminish carbohydrate tolerance and suggest “false diabetes.”
Glucose levels normally tend to increase with aging.
Prolonged oral contraceptive use causes significantly higher glucose levels in the second hour or in later blood specimens.
Infectious diseases, illnesses, and operative procedures affect glucose tolerance. Two weeks of recovery should be allowed before performing the test.
Certain drugs impair glucose tolerance levels (this list is not all inclusive; see Appendix E for other drugs):
Insulin
Oral hypoglycemics
Large doses of salicylates, anti-inflammatories
Thiazide diuretics
Oral contraceptives
Corticosteroids
Estrogens
Heparin
Nicotinic acid
Phenothiazines
Lithium
Metyrapone (Metopirone)
If possible, these drugs should be discontinued for at least 3 days before testing. Check with clinician for specific orders.
Prolonged bed rest influences glucose tolerance results. If possible, the patient should be ambulatory. A GTT in a hospitalized patient has limited value.
Explain test purpose and procedure. A written reminder may be helpful.
A diet high in carbohydrates (150 g) should be eaten for 3 days preceding the test. Instruct the patient to abstain from alcohol.
The patient should fast for at least 12 hours but not more than 16 hours before the test. Only water may be ingested during fasting time and test time. Use of tobacco products is not permitted during testing.
Patients should rest or walk quietly during the test period. They may feel weak, faint, or nauseated during the test. Vigorous exercise alters glucose values and should be avoided during testing.
Collect blood specimens at the prescribed times and record exact times collected. Urine glucose testing is no longer recommended.
Follow guidelines in Chapter 1 for safe, effective, informed pretest care.
Have the patient resume normal diet and activities at the end of the test. Encourage eating complex carbohydrates and protein if permitted.
Administer prescribed insulin or oral hypoglycemics when the test is done. Arrange for the patient to eat within a short time (30 minutes) after these medications are taken.
Interpret test results and counsel appropriately. Patients newly diagnosed with diabetes will need diet, medication, and lifestyle modification instructions.
Follow guidelines in Chapter 1 for safe, effective, informed posttest care.
If fasting glucose is >140 mg/dL (>7.8 mmol/L) on two separate occasions, or if the 2-hour postprandial blood glucose is >200 mg/dL (>11.1 mmol/L) on two separate occasions, GTT is not necessary for a diagnosis of diabetes mellitus to be established.
The GTT is of limited diagnostic value for children.
Follow instructions given for the GTT.
Draw a blood specimen from a fasting patient. The patient then drinks 50 g of lactose mixed with 200 mL of water (2 g lactose/kg body weight).
Draw blood lactose samples at 0, 30-, 60-, and 90-minute intervals.
Take breath hydrogen samples at the same time intervals as the blood specimens. Contact your laboratory for collection procedures.
Lactose intolerance occurs as follows:
A “flat” lactose tolerance finding (i.e., no rise in glucose) points to a deficiency of sugar-splitting enzymes, as in irritable bowel syndrome. This type of deficiency is more prevalent in American Indians, African Americans, Asians, and Jews.
A monosaccharide tolerance test such as the glucose/galactose tolerance test should be done as a follow-up.
The patient ingests 25 g of both glucose and galactose.
A normal increase in glucose indicates a lactose deficiency.
Secondary lactose deficiency found in:
Infectious enteritis
Bacterial overgrowth in intestines
Inflammatory bowel disease, Crohn’s disease
Giardia lamblia infestation
Cystic fibrosis of pancreas
The breath hydrogen test is abnormal in the lactose deficiency test because:
Malabsorption causes hydrogen (H2) production through the process of fermentation of lactose in the colon.
The H2 formed is directly proportional to the amount of test dose lactose not digested by lactase.
In diabetes:
Blood glucose values may show increases >20 mg/dL (>1.11 mmol/L) despite impaired lactose absorption.
In diabetes, there may be an abnormal lactose tolerance curve due to faulty metabolism, not necessarily from lactose intolerance.
Explain test purpose and procedure. The patient must fast for 8 to 12 hours before the test.
Do not allow the patient to eat dark bread, peas, beans, sugars, or high-fiber foods within 24 hours of the test.
Do not permit smoking during the test and for 8 hours before testing; no gum chewing.
Do not allow antibiotics to be taken for 2 weeks before the test unless specifically ordered.
Follow guidelines in Chapter 1 for safe, effective, informed pretest care.
Have the patient resume normal diet and activity.
Interpret test results and counsel appropriately. Patients with irritable bowel syndrome with gas, bloating, abdominal pain, constipation, and diarrhea have lactose deficiency. Restricting milk intake relieves symptoms.
Follow guidelines in Chapter 1 regarding safe, effective, informed posttest care.
Draw a 1-mL venous blood sample from a fasting patient using a red-topped chilled tube. Serum is needed for test. Date and time must be correct. Centrifuge blood for 30 minutes. Follow standard precautions.
Separate the blood at 4°C and freeze if it will not be tested until later.
Remember that a sample for glucose testing is usually drawn at the same time.
Place specimen in a biohazard bag.
Increased C-peptide values occur in the following conditions:
Endogenous hyperinsulinism (insulinemia)
Oral hypoglycemic drug ingestion
Pancreas or β-cell transplantation
Insulin-secreting neoplasms (islet cell tumor)
Type 2 diabetes mellitus (non-insulin-dependent)
Decreased C-peptide values occur in the following conditions:
Factitious hypoglycemia (surreptitious insulin administration)
Radical pancreatectomy
Type 1 diabetes mellitus
C-peptide stimulation test can determine the following:
Distinguishes between type 1 and type 2 diabetes mellitus.
Patients with diabetes whose C-peptide stimulation values are >1.8 ng/mL (>0.59 nmol/L) can be managed without insulin treatment.
Renal failure
Ingestion of sulfonylurea
Explain the test purpose and blood-drawing procedure. Obtain history of signs and symptoms of hypoglycemia.
Ensure that the patient fasts, except for water, for 8 to 12 hours before blood is drawn.
Remember that radioisotope test, if necessary, should take place after blood is drawn for C-peptide levels.
If the C-peptide stimulation test is done, give intravenous (IV) glucagon after a baseline value blood sample is drawn.
Follow guidelines in Chapter 1 for safe, effective, informed pretest care.
Draw a 5-mL blood sample from a fasting person into a chilled EDTA Vacutainer tube containing aprotinin (Trasylol) proteinase inhibitor. Special handling is required because glucagon is very prone to enzymatic degradation. Tubes used to draw blood must be chilled before the sample is collected and placed on ice afterward, and plasma must be frozen as soon as possible after centrifuging.
Observe standard precautions. Place specimen in a biohazard bag.
Increased glucagon levels are associated with the following conditions:
Acute pancreatitis (e.g., pancreatic α-cell tumor)
Diabetes mellitus: persons with severe diabetic ketoacidosis are reported to have fasting glucagon levels five times normal despite marked hyperglycemia.
Glucagonoma (familial) may be manifested by three different syndromes:
The first syndrome exhibits a characteristic skin rash, necrolytic migratory erythema, diabetes mellitus or impaired glucose tolerance, weight loss, anemia, and venous thrombosis. This form usually shows elevated glucagon levels (>1000 pg/mL or >1000 ng/L) (diagnostic).
The second syndrome occurs with severe diabetes.
The third form is associated with multiple endocrine neoplasia syndrome and can show relatively lower glucagon levels as compared with the others.
Chronic renal failure
Hyperlipidemia
Stress (trauma, burns, surgery)
Uremia
Hepatic cirrhosis
Hyperosmolality
Acute pancreatitis
Hypoglycemia
Reduced levels of glucagon are associated with the following conditions:
Loss of pancreatic tissue
Pancreatic neoplasms
Pancreatectomy
Chronic pancreatitis
Cystic fibrosis
Explain purpose of test and blood-drawing procedure. A minimum 8-hour fast (no calorie intake for at least 8 hours) is necessary before the test.
Promote relaxation in a low-stress environment; stress alters normal glucagon levels.
Do not administer radiopharmaceuticals within 1 week before the test.
Follow guidelines in Chapter 1 for safe, effective, informed pretest care.
Have patient resume normal activities.
Interpret test outcome and monitor for the three different syndromes of glucagonoma.
Follow guidelines in Chapter 1 for safe, effective, informed posttest care.
Obtain a 5-mL blood sample (red-topped tube) from a fasting (8 hours) person; serum is preferred. Observe standard precautions. Heparinized blood may be used.
If done in conjunction with a GTT, draw the specimens before administering oral glucose, at ingestion, and 120 minutes after glucose ingestion (the same times as the GTT).
Increased insulin values are associated with the following conditions:
Insulinoma (pancreatic islet tumor). Diagnosis is based on the following findings:
Hyperinsulinemia with hypoglycemia (glucose <30 mg/dL or <1.66 mmol/L)
Persistent hypoglycemia together with hyperinsulinemia (>20 µIU/mL or >139 pmol/L) after tolbutamide injection (rapid rise and rapid fall)
Failed C-peptide suppression with a plasma glucose level <30 mg/dL or <1.66 mmol/L and insulin/glucose ratio >0.3.
Type 2 diabetes mellitus, untreated
Acromegaly
Cushing’s syndrome
Endogenous administration of insulin (factitious hypoglycemia)
Obesity (most common cause)
Pancreatic islet cell hyperplasia
Decreased insulin values are found in the following conditions:
Type 1 diabetes mellitus, severe
Hypopituitarism
Surreptitious insulin or oral hypoglycemic agent ingestion or injection causes elevated insulin levels (with low C-peptide values).
Oral contraceptives and other drugs cause falsely elevated values.
Recently administered radioisotopes affect test results.
In the second to third trimester of pregnancy, there is a relative insulin resistance with a progressive decrease of plasma glucose and immunoreactive insulin.
Explain test purpose and procedure.
Ensure that the patient fasts from all food and fluid, except water, unless otherwise directed.
Insulin release from an insulinoma may be erratic and unpredictable; therefore, it may be necessary for the patient to fast for as long as 72 hours before the test.
Follow guidelines in Chapter 1 regarding safe, effective, informed pretest care.
Have patient resume normal activity and diet.
Interpret test results and counsel appropriately. Obese patients may have insulin resistance and unusually high fasting and postprandial (after eating) insulin levels. Explain possible need for further testing and treatment.
Follow guidelines in Chapter 1 regarding safe, effective, informed posttest care.
Obtain a 5-mL venous plasma sample from a fasting patient. A green-topped (heparin) or purpletopped (EDTA) tube may be used. Observe standard precautions.
Place the sample in an iced container. The specimen must be centrifuged at 4°C. Promptly remove plasma from cells. Perform the test within 20 minutes or freeze plasma immediately.
Note all antibiotics the patient is receiving; these drugs lower ammonia levels.
Reye’s syndrome (a potentially fatal disease associated with aspirin use secondary to viral infections primarily in children)
Liver disease, cirrhosis
Hepatic coma (does not reflect degree of coma)
GI hemorrhage
Renal disease
HHH syndrome: hyperornithinemia, hyperammonemia, homocitrullinuria
Transient hyperammonemia of newborn
Certain inborn errors of metabolism of urea except for argininosuccinic aciduria
GI tract infection with distention and stasis
Total parenteral nutrition
Ureterosigmoidostomy
Ammonia levels vary with protein intake and many drugs.
Exercise may cause an increase in ammonia levels.
Ammonia levels may be increased by use of a tight tourniquet or by tightly clenching the fist while samples are drawn.
Ammonia levels can rise rapidly in the blood tubes.
Hemolyzed blood gives falsely elevated levels.
Explain test purpose and procedure. Instruct the patient to fast (if possible) for 8 hours before the blood test. Water is permitted.
Do not allow the patient to smoke for several hours before the test (raises levels).
Follow guidelines in Chapter 1 regarding safe, effective, informed pretest care.
Interpret test outcomes, monitor appropriately, and begin treatment.
Remember that in patients with impaired liver function demonstrated by elevated ammonia levels, the blood ammonia level can be lowered by reduced protein intake and by use of antibiotics to reduce intestinal bacteria counts.
Follow guidelines in Chapter 1 for safe, effective, informed posttest care.
Obtain a 5-mL nonhemolyzed sample (red-topped tube) from a fasting patient. Observe standard precautions. Serum is used.
Protect the sample from ultraviolet light (sunlight).
Avoid air bubbles and unnecessary shaking of the sample during blood collection.
If the specimen cannot be examined immediately, store it away from light and in a refrigerator.
Total bilirubin elevations accompanied by jaundice may be due to hepatic, obstructive, or hemolytic causes.
Hepatocellular jaundice results from injury or disease of the parenchymal cells of the liver and can be caused by the following conditions:
Viral hepatitis
Cirrhosis
Infectious mononucleosis
Reactions to certain drugs such as chlorpromazine (antipsychotic medication used to treat manic depression or schizophrenia)
Obstructive jaundice is usually the result of obstruction of the common bile or hepatic ducts due to stones or neoplasms. The obstruction produces high conjugated bilirubin levels due to bile regurgitation.
Hemolytic jaundice is due to overproduction of bilirubin resulting from hemolytic processes that produce high levels of unconjugated bilirubin. Hemolytic jaundice can be found in the following conditions:
After blood transfusions, especially those involving many units
Pernicious anemia
Sickle cell anemia
Transfusion reactions (ABO or Rh incompatibility)
Crigler-Najjar syndrome (a severe disease that results from a genetic deficiency of a hepatic enzyme needed for the conjugation of bilirubin)
Erythroblastosis fetalis (see Neonatal Bilirubin)
Miscellaneous diseases
Dubin-Johnson syndrome (autosomal recessive disorder resulting in an increase in the serum levels of conjugated bilirubin)
Gilbert’s disease (familial hyperbilirubinemia)
Nelson’s disease (with acute liver failure)
Pulmonary embolism/infarct
Congestive heart failure
Elevated indirect (unconjugated) bilirubin levels occur in the following conditions:
Neonatal jaundice
Hemolytic anemias due to a large hematoma
Trauma in the presence of a large hematoma
Hemorrhagic pulmonary infarcts
Crigler-Najjar syndrome (rare)
Gilbert’s disease (conjugated hyperbilirubinemia; rare)
Elevated direct (conjugated) bilirubin levels occur in the following conditions:
Cancer of the head of the pancreas
Choledocholithiasis
Dubin-Johnson syndrome
A 1-hour exposure of the specimen to sunlight or high-intensity artificial light at room temperature will decrease the bilirubin content.
No contrast media should be administered 24 hours before measurement; a high-fat meal may also cause decreased bilirubin levels by interfering with the chemical reactions.
Air bubbles and shaking of the specimen may cause decreased bilirubin levels.
Certain foods (e.g., carrots, yams) and drugs (see Appendix E) increase the yellow hue in the serum and can falsely increase bilirubin levels when tests are done using certain methods (e.g., spectrophotometry).
Prolonged fasting and anorexia raises the bilirubin level.
Nicotinic acid increases unconjugated bilirubin.
Explain test purpose and procedure and relation of results to jaundice.
Ensure that the patient is fasting, if possible.
Follow guidelines in Chapter 1 for safe, effective, informed pretest care.
Interpret test outcome and monitor appropriately.
Have patient resume normal activities.
Follow guidelines in Chapter 1 for safe, effective, informed posttest care.
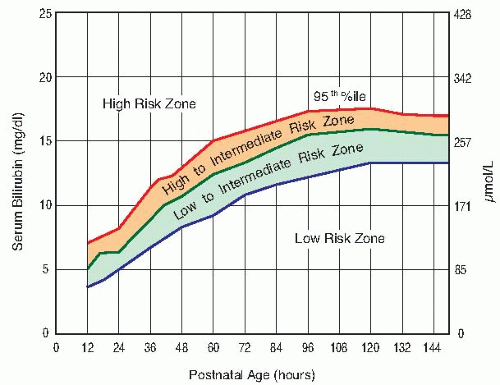 FIGURE 6.2. Nomogram for designation of risk in 2840 well newborns at 36 or more weeks’ gestational age with birth weight of 2000 g or more, or at 35 or more weeks’ gestational age and birth weight of 2500 g or more, based on the hour-specific serum bilirubin values. The serum bilirubin level was obtained before discharge, and the zone in which the value fell predicted the likelihood of a subsequent bilirubin level exceeding the 95th percentile (high-risk zone). (Used with permission from Bhutani VK, Johnson L, Sivieri EM. Predictive ability of a predischarge hour-specific serum bilirubin for subsequent significant hyperbilirubinemia in healthy term and near-term newborns. Pediatrics. 1999;103:6-14. Reprinted from American Academy of Pediatrics: Management of hyperbilirubinemia in the newborn infant 35 or more weeks of gestation. Pediatrics. 2004;114:297-316.) |
Draw blood from heel of newborn using a capillary pipette and amber Microtainer tube; 0.5 mL of serum is needed. Cord blood may also be used.
Protect sample from light.
Elevated total bilirubin (neonatal) is associated with the following conditions:
Erythroblastosis fetalis occurs as a result of blood group incompatibility between mother and fetus.
Rh (D) antibodies and other Rh factors
ABO antibodies
Other blood groups, including KIDD, KELL, and DUFFY (see Chapter 8)
Galactosemia
Sepsis
Infectious diseases (e.g., syphilis, toxoplasmosis, cytomegalovirus)
RBC enzyme abnormalities
Glucose-6-phosphate dehydrogenase (G6PD) deficiency
Pyruvate kinase (PK) deficiency
Spherocytosis (autohemolytic anemia causing the red blood cells to become sphereshaped and not the typical biconcave shape)
Subdural hematoma, hemangiomas
Elevated unconjugated (indirect) neonatal bilirubin is associated with the following conditions:
Erythroblastosis fetalis
Hypothyroidism
Crigler-Najjar syndrome
Obstructive jaundice
Infants of diabetic mothers
TABLE 6.4 Total Bilirubin Comparison
Premature (mg/dL)
SI Units (µmol/L)
Full Term (mg/dL)
SI Units (µmol/L)
<24 h:
<48 h:
3-5 d:
7 d:
<8.0
<12.0
<15.0
<15.0
<137
<205
<256
<256
<6.0
<10.0
<12.0
<10.0
<103
<170
<205
<170
Elevated conjugated (direct) neonatal bilirubin is associated with the following conditions:
Biliary obstruction
Neonatal hepatitis
Sepsis
Explain test purpose and procedure and its relation to jaundice to the mother.
See Chapter 1 guidelines for safe, informed, effective pretest care.
Interpret test outcome and monitor appropriately.
For slight elevations (i.e., <10.0 mg/dL or <170 µmol/L), phototherapy may be initiated.
Monitor neonatal bilirubin levels to determine indications for exchange transfusion. Tests should be done every 12 hours in jaundiced newborns. See Table 6.5 for exchange transfusion indications.
Transfuse at one step earlier in the presence of the following conditions:
Coombs’ test positive
Serum protein <5 g/dL
Metabolic acidosis (pH <7.25)
Respiratory distress (with O2 <50 mm Hg or 6.6 kPA)
Certain clinical findings (e.g., hypothermia; CNS or other clinical deterioration; sepsis; hemolysis)
nitrogen. A markedly increased BUN is conclusive evidence of severe impaired glomerular function. In chronic renal disease, the BUN level correlates better with symptoms of uremia than does the serum creatinine.
TABLE 6.5 Indications for Exchange Transfusion | ||||||
|---|---|---|---|---|---|---|
|
Obtain a 5-mL venous blood sample (red-topped tube). Serum is preferred.
Observe standard precautions.
Increased BUN levels (azotemia) occur in the following conditions:
Impaired renal function caused by the following conditions:
Congestive heart failure
Salt and water depletion
Shock
Stress
Acute MI
Chronic renal disease such as glomerulonephritis and pyelonephritis
Urinary tract obstruction
Hemorrhage into GI tract
Diabetes mellitus with ketoacidosis
Excessive protein intake or protein catabolism as occurs in burns or cancer
Anabolic steroid use
Decreased BUN levels are associated with the following conditions:
Liver failure (severe liver disease), such as that resulting from hepatitis, drugs, or poisoning
Acromegaly
Malnutrition, low-protein diets
Impaired absorption (celiac disease)
Nephrotic syndrome (occasional)
Syndrome of inappropriate antidiuretic hormone (SIADH)
A combination of a low-protein and high-carbohydrate diet can cause a decreased BUN level.
The BUN is normally lower in children and women because they have less muscle mass than adult men.
Decreased BUN values normally occur in late pregnancy because of increased plasma volume (physiologic hydremia).
Older persons may have an increased BUN when their kidneys are not able to concentrate urine adequately.
IV feedings only may result in overhydration and decreased BUN levels.
Many drugs may cause increased or decreased BUN levels.
Explain test purpose and blood-drawing procedure. Assess dietary history.
Follow guidelines in Chapter 1 for safe, effective, informed pretest care.
Interpret test outcome and monitor as appropriate for impaired kidney function.
In patients with an elevated BUN level, fluid and electrolyte regulation may be impaired.
Follow guidelines in Chapter 1 for safe, effective, informed posttest care.
Obtain 5 mL of serum in a light green tube. Fasting is not necessary.
Centrifuge within 30 minutes of blood draw. Place specimen in a biohazard bag.
Observe standard procedures.
Urine specimens may also be collected (see Chapter 3).
Increased albumin is not associated with any naturally occurring condition. When albumin is increased, the only cause is decreased plasma water that increases the albumin proportionally: dehydration.
Decreased albumin is associated with the following conditions:
Acute and chronic inflammation and infections
Cirrhosis, liver disease, alcoholism
Nephrotic syndrome, renal disease (increased loss in urine)
Crohn’s disease, colitis
Congenital albuminemia
Burns, severe skin disease
Heart failure
Starvation, malnutrition, malabsorption, anorexia (decreased synthesis)
Thyroid diseases: Cushing’s disease, thyrotoxicosis
Pregnancy (last trimester, owing to increased plasma volume)
Oral birth control (estrogens) and other drugs (see Appendix E)
Prolonged bed rest
IV fluids, rapid hydration, overhydration
Explain test purpose and specimen collection procedure. No fasting is required.
Follow guidelines in Chapter 1 for safe, effective, informed pretest care.
Interpret test outcome and monitor appropriately. Explain possible need for treatment (replacement therapy).
Low levels are associated with edema. Assess patient for these signs and symptoms.
Follow guidelines in Chapter 1 for safe, effective, informed posttest care.
Further tests may be indicated:
Total protein
Protein electrophoresis
24-hour urine protein
Collect a 7-mL blood serum sample in a red-topped tube. Observe standard precautions.
Place specimen in a biohazard bag for transport to the laboratory.
Hospital laboratories, in conjunction with dietitians, administration, pharmacists, nurses, and physicians, may develop a clinical pathway that includes running a PAB upon admission of each surgical, ICU, and medical patient.
Values of 0-5, 5-10, and 10-15 mg/dL (0-50, 50-100, and 100-150 mg/L) indicate severe, moderate, and mild protein depletion, respectively.
Explain test purpose. PAB is useful in assessing nutritional status, especially in monitoring the response to nutritional support in the acutely ill patient.
Follow guidelines in Chapter 1 regarding safe, effective, informed, pretest care.
Interpret test outcomes and determine the need for possible follow-up testing. Hospital protocol may require patients to be retested twice a week until discharge if their PAB level is less than 18 mg/dL (<180 mg/L). Possible treatment includes replacement and restorative therapy.
Follow guidelines in Chapter 1 regarding safe, effective, informed posttest care.
For serum cholinesterase, obtain a 5-mL blood sample; 3 mL of serum is needed. This is stable for 1 week at 39° to 77°F or 4° to 25°C. Observe standard precautions.
For RBC cholinesterase, draw a blood sample using sodium heparin as an anticoagulant; do not use serum. Observe standard precautions. This is stable for 1 week at 39° to 77°F or 4° to 25°C.
Decreased or no serum cholinesterase occurs in the following conditions:
Congenital inherited recessive disease. These patients are not able to hydrolyze drugs such as muscle relaxants used in surgery. These patients may have a prolonged period of apnea and may die if they are given succinylcholine.
Poisoning from organic phosphate insecticides
Liver diseases, hepatitis, cirrhosis with jaundice
Conditions that may have decreased blood albumin, such as malnutrition, anemia, infections, skin diseases, and acute MI
Congestive heart failure
Decreased RBC cholinesterase levels occur in the following conditions:
Congenital inherited recessive disease
Organic phosphate poisoning
Paroxysmal nocturnal hemoglobinemia
Megaloblastic anemia (returns to normal with therapy)
Increased serum cholinesterase is associated with
Type IV hyperlipidemia
Nephrosis
Obesity
Diabetes
Increased RBC cholinesterase is associated with:
Reticulocytosis (increase in immature red blood cells or reticulocytes)
Sickle cell anemia
Hemolytic anemias
Increased RBC cholinesterase in amniotic fluid, along with elevated alpha-fetoprotein (AFP), is presumptive evidence of open neural tube defect (not normally present in amniotic fluid).
Explain test purpose and procedure.
Draw blood for serum cholinesterase 2 days before surgery.
Be aware that blood should not be drawn in the recovery room; prior administration of surgical drugs and anesthesia invalidates the test results.
Follow guidelines in Chapter 1 for safe, effective, informed pretest care.
Interpret test outcome and counsel appropriately.
Consider patients exhibiting <70% inhibition to have an atypical cholinesterase variant, and be aware that the administration of succinylcholine or similar type drugs may pose a risk.
Follow guidelines in Chapter 1 for safe, effective, informed posttest care.
In industrial exposure, workers should not return to work until cholinesterase values rise to at least 75% of normal. RBC cholinesterase regenerates at the rate of 1% per day. Plasma cholinesterase regenerates at the rate of 25% in 7 to 10 days and returns to baseline in 4 to 6 weeks.
Cholinesterase activity is completely and irreversibly inhibited by organophosphate pesticides.
Obtain a 5-mL venous blood sample. Serum is preferred, but heparinized blood can be used. Place specimen in a biohazard bag.
Observe standard precautions.
Increased blood creatinine levels occur in the following conditions:
Impaired renal function
Chronic nephritis
Obstruction of urinary tract
Muscle disease
Gigantism
Acromegaly
Myasthenia gravis
Muscular dystrophy
Poliomyelitis
Congestive heart failure
Shock
Dehydration
Rhabdomyolysis (skeletal muscle tissue breakdown)
Hyperthyroidism
Decreased creatinine levels occur in the following conditions:
Small stature
Decreased muscle mass
Advanced and severe liver disease
Inadequate dietary protein
Pregnancy (0.4-0.6 mg/dL or 36-53 µmol/L is normal; >0.8 mg/dL or >71 µmol/L is abnormal and should be noted)
Increased ratio (>20:1) with normal creatinine occurs in the following conditions:
Increased BUN (prerenal azotemia), heart failure, salt depletion, dehydration
Catabolic states with tissue breakdown
GI hemorrhage
Impaired renal function plus excess protein intake, production, or tissue breakdown
Increased ratio (>20:1) with elevated creatinine occurs in the following conditions:
Obstruction of urinary tract
Prerenal azotemia with renal disease
Decreased ratio (<10:1) with decreased BUN occurs in the following conditions:
Acute tubular necrosis
Decreased urea synthesis as in severe liver disease or starvation
Repeated dialysis
SIADH
Pregnancy
Decreased ratio (<10:1) with increased creatinine occurs in the following conditions:
Phenacemide therapy (accelerates conversion of creatine to creatinine)
Rhabdomyolysis (releases muscle creatinine)
Muscular patients who develop renal failure
High levels of ascorbic acid and cephalosporin antibiotics can cause a falsely increased creatinine level; these agents also interfere with the BUN-to-creatinine ratio.
Drugs that influence kidney function plus other medications can cause a change in the blood creatinine level (see Appendix E).
A diet high in meat can cause increased creatinine levels.
Creatinine is falsely decreased by bilirubin, glucose, histidine, and quinidine compounds.
Ketoacidosis may increase serum creatinine substantially.
Explain test purpose and procedure.
Assess diet for meat and protein intake.
Follow guidelines in Chapter 1 for safe, effective, informed pretest care.
Interpret test results and monitor as appropriate for impaired renal function.
Possible treatment includes hemodialysis and renal replacement therapy, including kidney transplant.
Follow guidelines in Chapter 1 for safe, effective, informed posttest care.
No fasting is required.
Obtain a 5-mL venous blood sample (heparin or EDTA).
Explain purpose and sampling procedure for cystatin C.
Assess for signs of abnormal kidney function (hypertension, pain, edema, uremia, disorders of urination, and urine composition). Some conditions have no symptoms of nephrotic syndrome.
Follow Chapter 1 guidelines for safe, effective, informed pretest care.
Interpret outcomes and provide the patient with support and counseling.
Explain follow-up testing and possible treatment for kidney disease.
See Chapter 1 guidelines for safe, effective, informed posttest care.
Obtain a 5-mL venous blood sample. Serum is preferred; heparinized blood is acceptable. Place specimen in a biohazard bag.
Observe standard precautions.
Elevated uric acid levels (hyperuricemia) occur in the following conditions:
Gout (the amount of increase is not directly related to the severity of the disease)
Renal diseases and renal failure, prerenal azotemia
Alcoholism (ethanol consumption)
Down syndrome
Lead poisoning
Leukemia, multiple myeloma, lymphoma
Lesch-Nyhan syndrome (hereditary gout)
Starvation, weight-loss diets
Metabolic acidosis, diabetic ketoacidosis
Toxemia of pregnancy (serial determination to follow therapy)
Liver disease
Hyperlipidemia, obesity
Hypoparathyroidism, hypothyroidism
Hemolytic anemia, sickle cell anemia
Following excessive cell destruction, as in chemotherapy and radiation treatment (acute elevation sometimes follows treatment)
Psoriasis
Glycogen storage disease (G6PD deficiency)
Decreased levels of uric acid occur in the following conditions:
Fanconi’s syndrome (disease of the proximal renal tubules)
Wilson’s disease (autosomal recessive disorder resulting in the accumulation of copper in tissues)
SIADH
Some malignancies (e.g., Hodgkin’s disease, multiple myeloma)
Xanthinuria (deficiency of xanthine oxidase)
Stress and strenuous exercise will falsely elevate uric acid.
Many drugs cause increase or decrease of uric acid (see Appendix E).
Purine-rich diet (e.g., liver, kidney, sweetbreads) increases uric acid levels.
High levels of aspirin decrease uric acid levels.
Low purine intake, coffee, and tea decrease uric acid levels.
Advise patient of test purpose and blood-drawing procedure; fasting is preferred.
Promote relaxation; avoid strenuous exercise.
Follow guidelines in Chapter 1 for safe, effective, informed pretest care.
Have patient resume normal activities.
Interpret test results and monitor appropriately for renal failure, gout, or leukemia. Uric acid level should fall in patients who are treated with uricosuric drugs such as allopurinol, probenecid, and sulfinpyrazone.
Follow guidelines in Chapter 1 for safe, effective, informed posttest care.
Monitor uric acid levels during treatment of leukemia.
Acute, dangerous levels may occur following administration of cytotoxic drugs.
<15 years of age, >20 µg/dL or >0.97 µmol/L; ≥15 years of age, >30 µg/dL or >1.45 µmol/L
Patients with blood lead concentrations >80 µg/dL or >3.86 µmol/L (panic value) should be hospitalized immediately and treated as a medical emergency.
A single lead determination cannot distinguish between chronic and acute exposure.
Obtain a sample by finger stick using lead-free heparinized capillary tubes (capillary specimens are not considered diagnostic) or venous blood drawn in a 3-mL trace element-free tube. Place specimen in a lead-free biohazard bag or container.
Do not separate plasma from cells. Refrigerate the sample.
24-hour urine specimens can also be collected.
Hair may also be used.
Observe standard precautions.
<10 µg/dL or <0.48 µmol/L: normal without occupational exposure
<20 µg/dL or <0.97 µmol/L: acceptable with occupational exposure
>40 µg/dL or >1.9 µmol/L: report to state occupational agency
>60 µg/dL or >2.9 µmol/L: remove from occupational exposure and begin chelation therapy
TABLE 6.6 U.S. Centers for Disease Control and Prevention Classifications of Blood Lead Levels | ||||||||||||||||||||||||
|---|---|---|---|---|---|---|---|---|---|---|---|---|---|---|---|---|---|---|---|---|---|---|---|---|
| ||||||||||||||||||||||||
TABLE 6.7 Effects of Increased Blood Lead Levels on Children | ||||||||||||||||||||
|---|---|---|---|---|---|---|---|---|---|---|---|---|---|---|---|---|---|---|---|---|
| ||||||||||||||||||||
Failing to use lead-free Vacutainer tubes invalidates results.
An elevated level should be confirmed with a second specimen to ensure that the first specimen was not contaminated.
Following chelation therapy, lead levels are assessed at varying intervals, and it is not unusual to see a slight increase due to lead leaching from bones.
Pregnant women with blood lead level (BLL) >10 µg/dL or >0.48 µmol/L are at risk for delivering a child with a BLL also >10 µg/dL or >0.48 µmol/L.
Explain test purpose and procedure.
Explain the importance of follow-up if lead levels are elevated.
Follow guidelines in Chapter 1 for safe, effective, informed pretest care.
Have patient resume normal activities.
Interpret test results, counsel, and monitor appropriately for elevated lead levels. Explain chelation therapy and possible need for further testing, such as iron deficiency and blood protoporphyrins.
Parental compliance is necessary. Parent education about lead poisoning can be given face to face, by pamphlet distribution, or in both ways.
The most important component of medical management is to facilitate reduction in the child’s exposure to the environmental lead. In providing intervention for the child with an elevated blood lead level, the initial step is to obtain a detailed environmental history. The causes of childhood lead poisoning are multiple and must take into account potential environmental hazards as well as characteristics of the individual child. Once a child is found to have lead intoxication, all potential sources must be identified and removed from the child’s environment.
The recommended diet for a child with lead toxicity is simply a good diet with adequate protein and mineral intake and limitation of excess fat. It is no longer necessary to exclude canned foods and beverages when the cans are manufactured in the United States because the manufacture of cans with lead-soldered seams ended in the United States in 1991.
Iron deficiency can enhance absorption and toxicity of lead and often coexists with overexposure to lead. All children with a blood lead concentration >20 µg/dL or >0.97 µmol/L whole blood should have appropriate testing for iron deficiency.
In class IV lead intoxication, chelation is necessary. Chelation therapy must be done in conjunction with eliminating the source of the lead poisoning. Chelation therapy, when promptly administered, can be life-saving and can reduce the period of morbidity associated with lead toxicity.
Additional follow-up tests may be ordered, including free erythrocyte protoporphyrin, erythrocyte protoporphyrin, or zinc protoporphyrin.
Follow guidelines in Chapter 1 for safe, effective, informed posttest care.
Increased during bed rest and no increase in bone formation.
Increased with impaired renal function and no increase in bone formation.
Abnormally increased levels indicate increased bone formation in persons with hyperparathyroidism, fractures, and acromegaly.
Decreased levels are associated with hypoparathyroidism, a deficiency of growth hormone, and medications such as glucocorticoids, bisphosphonates, and calcitonin.
Explain purpose and procedure of test. Record age and menopausal state. Tell patient that the risk for osteoporosis steadily increases with age. Also obtain pertinent personal and family history of osteoporotic fractures, history of falls, and so forth.
Follow Chapter 1 guideline for safe, effective, informed pretest care.
Interpret test outcomes and counsel regarding further tests (e.g., dual-energy x-ray absorptiometry [DXA], bone density of the femoral neck, or quantitative ultrasound) and possible treatment (e.g., medical: alendronate, raloxifene). Sixteen percent of postmenopausal women will be found to have lumbar spine osteoporosis. Other blood test markers of bone resorption include pyridinolines, telopeptides, acid phosphatase, and urine tests of hydroxyproline and galactosyl hydroxylysine. These markers are known as collagen crosslinks.
See Chapter 1 for safe, effective, informed posttest care.
Obtain a 5-mL venous blood sample in the morning and place on ice. Serum or EDTA can be used. Observe standard precautions. Place specimen in a biohazard bag.
In women, collect this specimen 1 week before or after the menstrual period. Record date of last menstrual period on the laboratory form.
Increased androstenedione values are associated with the following conditions:
Stein-Leventhal syndrome (i.e., polycystic ovarian disease, an abnormal accumulation of underdeveloped follicles in the ovaries)
Cushing’s syndrome
Certain ovarian tumors (polycystic ovarian syndrome)
Ectopic ACTH-producing tumor
Late-onset congenital adrenal hyperplasia
Ovarian stromal hyperplasia
Osteoporosis in females
Decreased androstenedione values are found in the following conditions:
Sickle cell anemia
Adrenal and ovarian failure
Explain purpose of test and blood-drawing procedure. Obtain pertinent history of signs and symptoms (e.g., excessive hair growth and infertility).
Ensure that patient is fasting and that blood is drawn at peak production (7:00 a.m. or 0700 hours). Lowest levels are at 4:00 p.m. or 1600 hours.
Collect specimen 1 week before menstrual period in women.
Follow guidelines in Chapter 1 for safe, effective, informed pretest care.
Have patient resume normal activities.
Interpret test results and counsel appropriately for ovarian and adrenal dysfunction.
Follow guidelines in Chapter 1 for safe, effective, informed posttest care.
Take plasma with the patient in an upright position for 2 hours and with normal salt intake.
Obtain a 5-mL venous blood specimen in a heparinized or EDTA Vacutainer tube. Serum, EDTA, or heparinized blood may be used. The cells must be separated from plasma immediately. Blood should be drawn with patient sitting. Observe standard precautions.
Specify and record the time of the venipuncture. Circadian rhythm exists in normal subjects, with levels of aldosterone peaking in the morning. Specify if the blood has been drawn from the adrenal vein (values are much higher: 200-800 ng/dL or 5.5-22.6 nmol/L).
Be aware that a 24-hour urine specimen with boric acid preservative may also be ordered. Refrigerate immediately following collection.
Have patient follow a normal sodium diet 2 to 4 weeks before test.
Ensure that low potassium is treated before test.
Elevated levels of aldosterone (primary aldosteronism) occur in the following conditions:
Aldosterone-producing adenoma (Conn’s disease)
Adrenocortical hyperplasia (pseudoprimary aldosteronism)
Indeterminate hyperaldosteronism
Glucocorticoid remediable hyperaldosteronism
Secondary aldosteronism, in which aldosterone output is elevated because of external stimuli or greater activity in the renin-angiotensin system, occurs in the following conditions:
Salt depletion
Potassium loading
Laxative abuse
Cardiac failure
Cirrhosis of liver with ascites
Nephrotic syndrome
Bartter’s syndrome
Diuretic abuse
Hypovolemia and hemorrhage
After 10 days of starvation
Toxemia of pregnancy
Decreased aldosterone levels are found in the following conditions:
Aldosterone deficiency
Addison’s disease
Syndrome of renin deficiency (very rare)
Low aldosterone levels associated with hypertension are found in Turner’s syndrome, diabetes mellitus, and alcohol intoxication
Values are increased by upright posture.
Recently administered radioactive medications affect test outcomes.
Heparin therapy causes levels to fall. See Appendix E for drugs that increase or decrease levels.
Thermal stress, late pregnancy, and starvation cause levels to rise.
Aldosterone levels decrease with age.
Many drugs—diuretics, antihypertensives, progestogens, estrogens—and licorice should be terminated 2 to 4 weeks before test.
The simultaneous measurement of aldosterone and renin is helpful in differentiating primary from secondary hyperaldosteronism. Renin levels are high in secondary aldosteronism and low in primary aldosteronism.
Potassium deficiencies should be corrected before testing for aldosterone.
Explain test purpose and procedures. Assess for history of diuretic or laxative abuse. If 24-hour urine specimen is required, follow protocols in Chapter 3.
Discontinue diuretic agents, progestational agents, estrogens, and black licorice for 2 weeks before the test.
Ensure that the patient’s diet for 2 weeks before the test is normal (other than the previously listed restrictions) and includes 3 g/day (135 mEq/L/day) of sodium. Check with your laboratory for special protocols.
Follow guidelines in Chapter 1 for safe, effective, informed pretest care.
Have patient resume normal activities and diet.
Interpret test results and monitor appropriately for aldosteronism and aldosterone deficiency.
Follow guidelines in Chapter 1 for safe, effective, informed posttest care.
Draw venous blood samples, 5 mL, into prechilled tubes and put on ice. Plasma with EDTA anticoagulant is needed. Observe standard precautions. Place specimen in a biohazard bag.
Ensure that patient is in a sitting position and calm during blood collection.
Increased secretion of ADH is associated with the following conditions:
SIADH (with respect to plasma osmolality)
Ectopic ADH production (systemic neoplasm)
Nephrogenic diabetes insipidus
Acute intermittent porphyria
Guillain-Barré syndrome (acute polyneuropathy, ascending paralysis)
Brain tumor, diseases, injury, neurosurgery
Pulmonary diseases (tuberculosis)
Decreased secretion of ADH occurs in the following conditions:
Central diabetes insipidus (hypothalamic or neurogenic)
Psychogenic polydipsia (water intoxication)
Nephrotic syndrome
Recently administered radioisotopes cause spurious results.
Many drugs affect results (e.g., thiazide diuretics, oral hypoglycemics, and narcotics); see Appendix E.
Explain test purpose and procedure.
Encourage relaxation before and during blood-drawing procedure.
Follow guidelines in Chapter 1 for safe, effective, informed pretest care.
Resume normal activities.
Interpret test results and counsel appropriately for urine concentration disorders and polyuria.
Follow guidelines in Chapter 1 for safe, effective, informed posttest care.
Obtain a plasma sample by venipuncture from a fasting patient. Use a lavender-topped (EDTA) tube. If a nonfasting sample is obtained, notify laboratory.
Prechill the tube at 4°C before drawing sample. After drawing sample, chill tube in wet ice for 10 minutes. Place specimen in a biohazard bag.
Diastolic dysfunction
Decrease in left ventricular ejection fraction
Congestive heart failure
Type of Heart Failure | Signs and Symptoms | Tests to Diagnose |
Left heart failure (congestive heart failure) Stay updated, free articles. Join our Telegram channel
Full access? Get Clinical Tree
 Get Clinical Tree app for offline access

|