Until relatively recently, our knowledge of brain organization was based on observations of patients with lesions. Focal brain lesions (e.g., from stroke or trauma) were studied postmortem, and behavioral deficits were correlated with damaged brain areas. This method had obvious disadvantages, not the least of which was the necessity of waiting for patients to die before having the opportunity to correlate behavioral, neurologic, and neuroanatomic findings. However, this method also generated a great deal of what we know about brain–behavior correlations. For example, Broca used this method to identify left inferior frontal lesions as being responsible for nonfluent aphasia, and Wernicke used it to identify left superior temporal lesions as being responsible for fluent aphasia. 1
In the early 20th century, X-ray technology was introduced, and skull X-rays allowed the two-dimensional imaging of bony anatomy as well as abnormal calcifications within the cranium. Later, invasive X-ray techniques were developed that used contrast agents. Air was introduced into the subarachnoid space to study ventricular anatomy via pneumoencephalography, and radiodense contrast was introduced in the carotid arteries to study vascular anatomy with cerebral angiography. These invasive techniques have associated risks and discomfort. Pneumoencephalography in particular was painful and was abandoned as soon as more advanced imaging techniques became available. Cerebral angiography has been considerably refined to reduce its risk and discomfort and to improve its diagnostic value.
Since the mid-1970s, new technologies have emerged that permit the study of the brain in vivo, noninvasively, with fewer risk factors, and three-dimensionally. Computed tomography (CT) and magnetic resonance imaging (MRI) are currently commonly used in most medical centers and have contributed greatly to the field of neuroscience and to direct patient care. Functional magnetic resonance imaging (fMRI), positron emission tomography (PET), single-photon emission computed tomography (SPECT), and near-infrared spectroscopic (NIRS) mapping are less frequently used. Some techniques, such as CT and MRI, are designed to study brain structure, while others, like fMRI, PET, SPECT, and NIRS, are used to explore brain function. Neuroimaging has been used both clinically, to diagnose abnormalities or to monitor disease progression, and in neuroscience research, mainly for the investigation of brain–behavior relationships.
This chapter aims to introduce these technologies to the speech-language pathologist. Neuroimaging technology is highly complex and continuously evolving. The presentation of these techniques in the current chapter must necessarily be kept simple and basic to make them more meaningful for our field.
3.2 Cerebral Angiography
Although not technically a neuroimaging technique, traditional angiography is still in clinical use and is therefore important to understand. The term angiography indicates the use of an X-ray exam of the arteries and veins to diagnose blockages and other vascular problems. An arteriogram is specific to the study of arteries, and a venogram studies veins. In all cases, the methodology is similar. A slender catheter is threaded into the femoral artery in the groin and is guided to the area of interest. To study the blood distribution in the brain, the catheter is guided into the carotid artery with the help of X-ray fluoroscopy. A contrast agent is injected through the catheter, flooding the blood vessels and making them highly visible ( ▶ Fig. 3.1).
Fig. 3.1 Right carotid angiogram obtained before a Wada test, demonstrating the carotid bifurcation. The internal carotid artery is to the left.
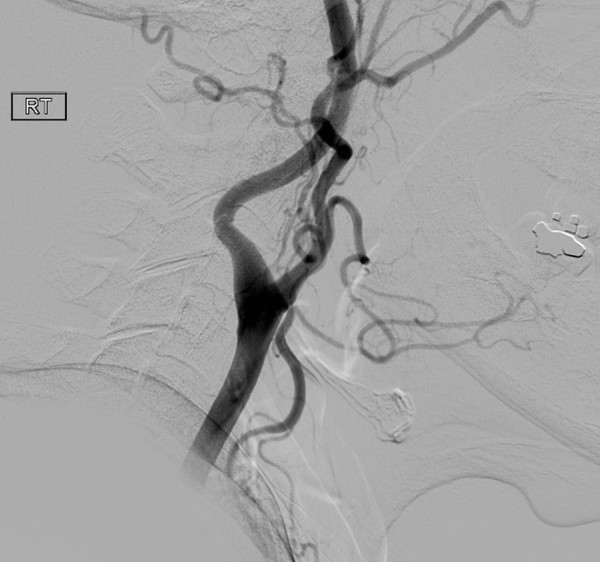
Angiograms allow the evaluation of the vascular system, making possible the detection of anomalies like aneurysms (a weakened, bulging area) or stenosis (narrowing of the vessel). Other conditions that may be detected by this method include tumor or hemorrhage impinging on blood vessels, or blood vessel inflammation resulting in vascular irregularity. However, other imaging techniques are much better at detecting brain parenchymal abnormalities.
Angiography carries serious risks, though small. The catheter may damage a blood vessel or dislodge an embolus, and the contrast may cause allergic reactions, some serious. Contrast agents may also worsen renal impairment for those with kidney problems. Currently, angiography is more commonly used in conjunction with CT and MRI, which reduces its invasiveness and risks. The contrast is usually administered intravenously, and vessels are visualized by CT or MRI, thus avoiding use of the catheter and its associated risk factors.
3.3 Computed Tomography
Computed tomography (CT) scans are basically three-dimensional representations constructed from X-ray images. The patient is placed inside a tube that rotates as it takes a series of X-rays. A computer then compiles the X-rays into complete, cross-sectional ‘slices’ of the targeted structure, useful for visualizing structures at different depths within the body.
The principle behind this technology is that tissues attenuate (or weaken) the X-ray beam as it passes through the body. The degree of attenuation depends on the density of the tissue. Bone has a high density and appears white; water has a low density and appears dark. Differences in color and shade on CT scans, therefore, distinguish tissues with different densities. In cases when tissues of similar density must be differentiated, a contrast agent may be helpful. The contrast is usually a pharmaceutical compound containing iodine that is absorbed selectively by certain tissues.
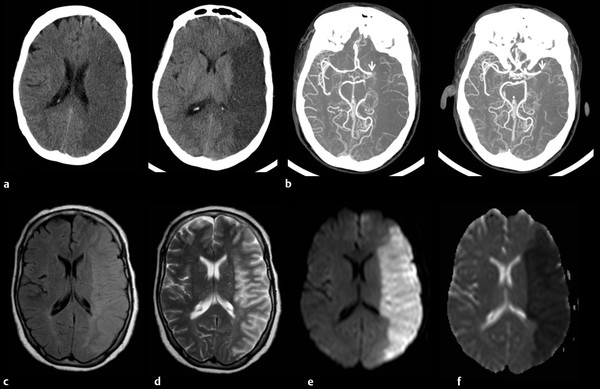
In the brain, CT scans can show, for example, the basal ganglia, brainstem, or cerebellum, deep structures that were previously difficult to image. Because of its ability to visualize structures distinctly, CT is described as having high spatial resolution. CT is an ideal diagnostic tool for the detection of some structural abnormalities, including ventricular abnormalities, bone fractures, blood, and edema. CT scans can also be used to produce very clear, and noninvasive, angiograms with the use of a contrast agent. A CT angiogram (referred to as a CTA) visualizes the presence of arterial structural anomalies with a high degree of resolution and is therefore used in the management of hypertension and trauma ( ▶ Fig. 3.2).
Fig. 3.2 (a) Computed tomography (CT), (b) CT angiogram, and (c–f) axial magnetic resonance imaging (MRI) in a 64-year-old patient with a left middle cerebral artery (MCA) infarct. The CT scan shows decreased density corresponding to the MCA distribution. The CT angiogram demonstrates an occlusion of the left MCA (arrow). The infarct appears brighter on both (c) fluid-attenuated inversion recovery (FLAIR) and (d) T2-weighted images, but is best demonstrated on (e) diffusion-weighted imaging (DWI) and (f) apparent diffusion coefficient (ADC) images.
CT scans are easy to obtain because CT scanners are common to most medical centers, the scans are fast to produce, typically taking less than 5 minutes, and they are relatively inexpensive, all of which make CT the first choice of imaging in many neurologic emergencies, such as acute trauma or stroke. The major disadvantage of CT is moderate to high radiation exposure. A typical chest CT delivers a dose of radiation approximately 175 times greater than a chest X-ray and equivalent to 20 sets of mammograms. Epidemiologic studies show that repeat CT scans may increase the risk of cancer, particularly for children. 2 However, if a CT scan is truly indicated, the benefit far outweighs the slightly increased risk of cancer. Additionally, recent technological advances allow high-resolution images with a drastic reduction in the radiation dose. Another disadvantage of CT is the use of the contrast agent, which presents risks to patients with compromised renal function or allergies.
CT images are limited by bone streak artifacts in regions surrounded by thick bone, such as the brainstem and the temporal lobes. Another major limitation is in the early stages of ischemic stroke, where the CT scan may appear normal or show only subtle changes. In response to the need for improved detection of early ischemic stroke, perfusion tomography was developed. Perfusion tomography uses software with a standard CT scanner to produce a perfusion cortical map based on cerebral blood flow, cerebral blood volume, and transit time. It can identify regions of the brain at risk of stroke because of poor perfusion. Perfusion tomography is showing promise in the diagnosis and management of acute stroke as well as other cerebrovascular conditions.
3.4 Magnetic Resonance Imaging
Magnetic resonance imaging (MRI) is a complex technology that has made important contributions to health care and that is used in most major medical centers worldwide. Many applications are associated with MRI, but only the most pertinent to our field are described here.
MRI technology depends on two main components: a powerful magnet and radio waves. MRI is based on the properties of the hydrogen atom, which is present inside every part of the body to varying extents. The core of the hydrogen atom contains a single proton with an inherent spin like a top. A magnetic field will make these protons spin around the longitudinal axis of the magnetic field, and the stronger the magnet, the faster the spin (about 50 million times per second in a water molecule).
During the MRI, the patient is placed inside a tube-like machine housing a strong magnet, hundreds of thousands of times stronger than the earth’s magnetic field. This large magnetic field is used to align the majority of the water protons along the same longitudinal axis. When excited by a radio wave pulse at the resonant frequency, the protons begin to spin in phase with each other in the transverse plane. After the pulse, the protons begin to relax back to their normal spin about the longitudinal axis and de-phase in the transverse plane. At some time after the pulse and during the relaxation, the MRI signal in the receiver is measured. Protons in different tissues have different relaxation properties; and so the protons in tissues that relax slower or faster than others may have different MRI signals than others at the measured time.
The radio pulses switch on and off rapidly, setting off rapid-fire clicking noises amplified by the tube-like scanner, which makes the MRI machine a very noisy place indeed. In our institution, patients are provided with earplugs to attenuate the loud noise. The pattern of electromagnetic excitation, the timing of reception, and the processing of signals vary with MRI technique sequences and can display various properties of the tissue. MRI sequences most commonly used in clinical practice include T1-weighted, T2-weighted, fluid-attenuated inversion recovery (FLAIR), and diffusion-weighted types ( ▶ Fig. 3.2 and ▶ Fig. 3.3).
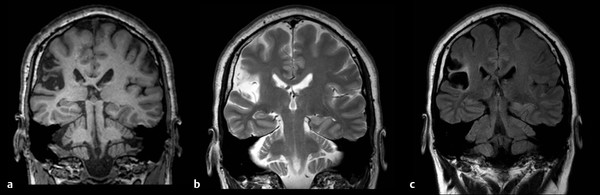
Fig. 3.3 Coronal magnetic resonance imaging (MRI) in a 42-year-od man with an old right middle cerebral artery (MCA) stroke. (a) The T1 image shows a smaller right hemisphere with a dark area of encephalomalacia. (b) The T2 image shows that both the scarred tissue and cerebrospinal fluid (CSF) are white. (c) The fluid-attenuated inversion recovery (FLAIR) image allows the distinction between CSF (black) and scarred brain tissue (white).
T1-weighted, also called spin-lattice relaxation time, is a tissue property reflecting the amount of time it takes the protons to relax back to the spin about the longitudinal axis. T1-weighted MRI sequences provide highly detailed anatomical information. Using T1, white and gray matter are differentiated in the brain, and fat and water are contrasted elsewhere in the body. Water-filled tissue appears dark, and fat-filled tissue appears white. Gray matter is darker than white matter. In cases of demyelinating diseases like multiple sclerosis (MS), the fat is stripped away and replaced by water, making tissues appear darker than normal. Such lesions are clearly seen on MRI but are often not detected by CT scans.
T2-weighted, also called spin-spin relaxation time, is a property reflecting the amount of time to de-phase the spins in the transverse plane. On T2-weighted scans, water- and fluid-filled tissues appear bright, and fat-containing tissues appear less bright (in direct contrast to T1). Gray matter appears brighter than white matter. T2-weighted scans are the most sensitive to tissue pathology. Abnormalities usually appear bright on T2 images. In particular, when damaged tissues develop edema, the damaged sections appear brighter than normal tissue.
FLAIR sequences are used to suppress the signal from fluids. In brain imaging, FLAIR is used to suppress cerebrospinal fluid (CSF) so as to highlight hyperintense lesions like those in MS. FLAIR images are very similar to T2-weighted images except that water appears dark. This allows for distinction between regions of parenchymal brain pathology and fluid-filled areas.
Diffusion-weighted MRI (dMRI) is particularly useful in neurology. 3 dMRI is used to measure the diffusion of water molecules in tissues and is used to study the connectivity of axons in white matter. The most important application of dMRI is diffusion-weighted imaging (DWI), which is able to detect ischemic stroke only 5 to 10 minutes after onset of symptoms (faster than CT, which may not detect changes of acute infarct for 4 to 6 hours, and faster than other MRI sequences). DWI images are often viewed in conjunction with apparent diffusion coefficient (ADC) images. An area of stroke that appears bright on DWI images will appear dark on ADC images ( ▶ Fig. 3.2). Diffusion tensor imaging (DTI) is an application of dMRI useful for making brain maps of connectivity of white matter fibers, a particular clinical application in the examination of areas of neural degeneration and demyelination. ▶ Table 3.1 compares the most common clinical MRI sequences.
T1 | T2 | FLAIR | dMRI | MRA | |
Advantages | Detailed anatomical image | Sensitive to pathology | Sensitive to pathology | Detects infarcts within minutes | Images vasculature; less invasive than traditional angiography |
CSF appearance | Dark | Bright | Dark (CSF nulled) | Dark | NA |
Gray matter | Darker | Brighter | Brighter | Brighter | NA |
White matter | Brighter | Darker | Darker | Darker | NA |
Abbreviations: CSF, cerebrospinal fluid; dMRI, diffusion-weighted MRI; FLAIR, fluid-attenuated inversion recovery; MRA, magnetic resonance angiography; NA, not applicable. | |||||
When a patient receives an MRI scan, the patient has actually received a series of MRI scan sequences. A sequence of scans is selected based on the suspected pathology or the physician’s recommendations. In our institution, MRI protocols are often named after the conditions in question or for the physician ordering them. The sequences may include any or all of the above-mentioned MRI applications, or some other sequences not discussed in this chapter. Of note is that MRI use has not been standardized, meaning that different centers may adopt protocols specific to them; in fact, within the same center, different physicians may adopt personalized protocols.
As with CT, MRI images are often enhanced with a contrast agent, usually gadolinium (Gd), administered intravenously; contrast improves visualization of blood vessels. Breakdown of the blood–brain barrier enhances the visualization of lesions like tumors and areas of inflammation. Contrast is most often used with a T1 sequence. Also like CT, MRI can be used to provide an angiogram (referred to as an MRA).
The advantages of MRI are many. Most prominently, because it doesn’t involve radiation, MRI is safe for pregnant women, children, and people vulnerable to the effects of radiation. The disadvantages include cost, both of the machine and of scans. Additionally, it takes 15 to 60 minutes inside a scanner to obtain the necessary MRI sequences; the time required, combined with the small space and the loud noise, can make it difficult to perform an MRI without sedation in a claustrophobic subject. Another major disadvantage is that an MRI can be affected by movement, so patients are required to remain very still for the duration of the scan; people with movement disorders or individuals unable to cooperate (such as those with severe trauma and agitation) may not be suitable candidates for an MRI scan without anesthesia. The use of a contrast agent may also be problematic for some patients, particularly for those with severe renal compromise; in our institution, an order for a contrast-enhanced MRI is double-checked with the physician for pertinent patient history before the scan can proceed. Finally, MRI is often contraindicated for people with some metal implants, such as old pacemakers or cerebral aneurysm clips. However, newer versions of pacemakers and aneurysm clips are MRI compatible.
Comparison of CT and MRI shows that CT is superior at imaging bone, while MRI offers higher-resolution images of soft tissues. MRI is superior to CT in contrast resolution, defined as the ability to distinguish between similar but not identical tissues (e.g., ligaments and cartilage). MRI is more sensitive to brain parenchymal pathology and is not affected by bone artifact, so that it is much superior to CT for imaging of the brainstem and temporal lobe. CT scans utilize radiation while MRI is considered a low-risk technology. A CT scan is fast, usually no longer than 5 minutes, whereas an MRI can take significantly longer.
3.5 Functional MRI
Functional MRI (fMRI) is an application of standard MRI technology that produces images of metabolic function. 4 The primary form of fMRI uses blood oxygen level dependent (BOLD) contrast to indirectly map neural activity in the brain and spinal cord. This method takes advantage of the fact that oxyhemoglobin (oxygen-rich blood) and deoxyhemoglobin (oxygen-poor blood) have different magnetic properties. A specific T2-weighted MRI sequence is sensitive to these differences. Deoxyhemoglobin’s T2-weighted MRI signal is slightly decreased compared to that of oxyhemoglobin. When a part of the brain is utilized for a specific task, the neurons in that region require more oxygen and blood flow is increased to that region; deoxyhemoglobin decreases while oxyhemoglobin increases, yielding a slight increase in the T2-weighted MRI signal.
In a basic fMRI experiment, a subject alternates between an inactive (or control) and active state (e.g., watching a static cross-hair on a screen vs. watching a flashing checkerboard). Tens to hundreds of brain images are acquired in both states and are compared to determine the cerebral locations where the images are significantly different between the two states. These regions are said to be “activated” during the task.
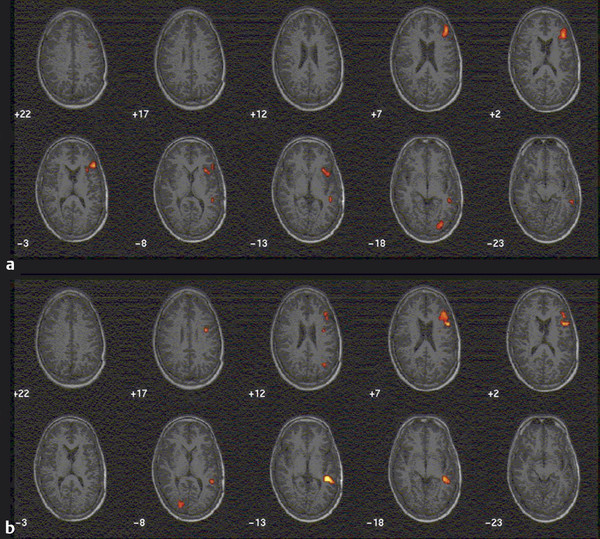
Clinically, fMRI is most often used to localize brain function, such as language, sensorimotor, and visual functions. fMRI is also used extensively in research, such as studying memory, language, learning, and emotion, among other topics. In studies of normal brain functions, figures of BOLD activation are typically averages of findings from study participants rather than individual scans. Patterns of activation are typically superimposed on structural MRI ( ▶ Fig. 3.4).
Fig. 3.4 Functional magnetic resonance imaging (fMRI) in a 33-year-old man being considered for epilepsy surgery. Panel a (top) demonstrates activation in response to a task of word generation from letters. The control task is rest. This task produced activation of Broca’s area, but only weak activation in Wernicke’s area. Panel b (bottom) reflects activation in a reading task. The patient was shown item descriptions followed by the corresponding correct or incorrect label. The control task is a string of symbols. This task produced a more vigorous activation of Wernicke’s area.
Stay updated, free articles. Join our Telegram channel

Full access? Get Clinical Tree


