Knowledge of laryngeal anatomy and physiology is critical to the practice of medical speech-language pathology. 1 Diseases and disorders that affect communication and swallowing in general often impact laryngeal functioning. In addition, surgical and medical procedures (e.g., thyroidectomy, intubation for respiratory failure) can result in detrimental effects on voice production through damage to peripheral nerves or through direct injury to laryngeal structures. The diagnosis and management of voice disorders rely heavily on familiarity with the fields of otolaryngology, neurology, pulmonary medicine, gastroenterology, and surgical specialties (thoracic surgery, general surgery, and neurosurgery). Physicians in these specialties refer patients to the speech-language pathologist (SLP) with questions regarding confirmation of the voice disorder, description of the dysphonia, prognosis for improvement with voice therapy (either alone or combined with other treatment modalities), subsequent coordinated management, and, finally, behavioral therapy for the disorder. Practice guidelines in speech-language pathology state that patients with suspected voice disorders cannot be treated without an otolaryngologic examination, as laryngeal cancer and airway compromise may present as hoarseness. 2 Due to the life-threatening nature of these conditions, a laryngoscopic exam must be performed by an otolaryngologist before beginning any treatment program for a patient with a voice disorder. Speech-language pathologists often find that they must educate physicians in other medical specialties as well as other professionals who care for patients with voice disorders (e.g., voice teachers). These individuals may not be aware of our practice standards that protect the patient.
This chapter presents a broad overview of voice pathology practice in the medical setting. We discuss general principles related to the diagnosis and management of voice disorders, and specific diagnostic and treatment issues for various classes of voice disorders. For more information about the diagnosis and management of voice disorders, several texts provide excellent coverage of this topic in depth. 3, 4, 5, 6, 7, 8, 9 Also, the reader is directed to Chapter 9, Chapter 13, and Chapter 18 for other relevant discussions. In addition, there are many opportunities for continuing education in this area: recurring meetings, such as the Fall Voice Conference (www.fallvoice.org), Annual Symposium: Care of the Professional Voice (www.voicefoundation.org), and Pacific Voice Conference; courses in specific treatment methodologies (e.g., LSVT, LMRVT); and courses in videostroboscopy hosted by various clinical voice practices (e.g., Vanderbilt Voice Center, Emory Voice Center). Some centers offer opportunities for observation.
12.1 Principles of Diagnosis and Management
Until the early 1980s, the practice of voice pathology relied heavily on auditory perceptual judgments of voice production for the differential diagnosis of dysphonia. However, in the past 30 years, clinical voice laboratories have emerged, and current practice in voice pathology relies on the objective analysis of voice production to complement perceptual analysis. This shift to more technology-based practice has placed increased demands on voice pathologists to be knowledgeable about instrumental measures and their application to diagnosis and treatment. Many clinicians also use endoscopy and computer-based programs as treatment modalities to supplement traditional voice therapy. It is expected that this trend will continue, and recommended competencies developed by American Speech-Language-Hearing Association (ASHA) reflect this. 1
12.1.1 Diagnosis of Voice Disorders
The aims of the diagnostic process for voice disorders are not so very different from those in other areas of specialization in speech-language pathology. Ultimately, the goal of assessment in medical speech-language pathology is to answer the question proposed by the referring physician. Steps in this process include establishing an etiology, identifying factors contributing to the disorder, creating a hierarchy of those factors in order of significance, estimating the severity of the disorder (from the clinician and patient perspectives), establishing prognosis, determining a treatment approach, identifying outcomes measures that will support treatment effectiveness, and determining other appropriate referrals. The ‘tools’ that SLPs use for the diagnosis of voice disorders are the history of the disorder, auditory perceptual analysis, instrumental measures, and descriptive scales of severity. ▶ Table 12.1 lists the types of voice disorders and the etiologies that are associated with them.
Type of Voice Disorder | Possible Etiologies |
Functional (nodules, polyps, cysts, edema, musculoskeletal tension, Reinke’s edema, contact ulcer, granuloma) | Voice production techniques (misuse) Voice use/hygiene (abuse, overuse) |
Atypical (psychogenic) (dysphonia/aphonia in presence of normal-appearing larynx, musculoskeletal tension) | Conversion event Psychiatric illness Nonspecific |
Neurogenic (paresis, paralysis, myoclonus, spasmodic dysphonia, tremor, apraxia) | Upper motor neuron disease: amyotrophic lateral sclerosis (ALS), cortical/subcortical stroke, multiple sclerosis (MS) |
Lower motor neuron disease: direct damage to recurrent laryngeal nerve/superior laryngeal nerve, idiopathic (unknown etiology); brainstem stroke, MS, ALS, neurofibromatosis | |
Extrapyramidal disorders: Parkinson’s disease (PD), | |
Huntington’s chorea (HC), MS | |
Cerebellar disorders: stroke, MS, degeneration | |
Myoneural junction/muscle disorders: myasthenia gravis, polymyositis, muscular dystrophy | |
Traumatic brain injury (multiple neurologic sites) | |
Local irritation/systemic effects (edema, Reinke’s edema, granuloma) | Gastroesophageal reflux; |
Drugs (corticosteroid inhalers, antihistamines) | |
Irritative inhaled substance (cigarettes, environmental) | |
Allergies | |
Lupus, rheumatoid arthritis | |
Upper respiratory infection | |
Menopause | |
Sarcoidosis | |
Intubation | |
Neoplastic (benign: papilloma, amyloid deposit; malignant) | Carcinoma (usually squamous cell) |
Papillomatosis | |
Leukoplakia/dysplasia | |
Amyloidosis |
As the use of voice assessment protocols expands, there is always the question about whether available measures have a foundation in evidence. In 2007, a working group was established by ASHA to plan and carry out an evidence-based systematic review of diagnostic test accuracy. The working group collaborated with ASHA’s National Center for Evidence-Based Practice in Communication Disorders (N-CEP) in this effort. They identified 100 articles published between 1930 and 2009 that met the inclusion criteria. They found that, in order of frequency, the articles examined primarily acoustic analysis, laryngeal imaging, and auditory perceptual assessment. 10 However, they noted that no particular measure met overwhelming criteria for evidence for inclusion in an assessment protocol. Ultimately, more research is needed to make a definitive determination of evidence-based components of a comprehensive assessment for patients with voice disorders.
Obtaining a Comprehensive History
Obtaining the history is one of the most important steps in the evaluation process for voice disorders. In the diagnostic process for neurogenic communication disorders, standardized testing determines the nature of the disorder; in voice disorders, the history of the voice disorder may provide most of the facts necessary to diagnose the dysphonia and determine the etiology. Information gathered during history taking often drives the remainder of the assessment and determines what direction it takes. Certain elements of the history are significant for establishing the etiology of the voice disorder. Factors that are important in differential diagnosis are the patient’s description of the problem; onset (sudden versus gradual); character of the dysphonia (consistent versus variable); voice use patterns (at work, during leisure, at school); other associated events and comorbid illnesses at the time of the onset of the dysphonia; and duration of the dysphonia (lifelong versus isolated event). Accounts of medical and surgical history, medications (including over-the-counter and illicit drugs, vitamins and other supplements), hydration, caffeine intake, smoking and alcohol use, and history of psychological intervention are important. A review of the medical history with attention to the types of prior illnesses (e.g., back pain, chronic headaches) may be helpful in establishing a history of somatization. Finally, work and social histories help to establish patients’ personality styles and their manner of coping with daily stresses.
Auditory Perceptual Analysis
Aural judgments of voice quality have been used for many years in the diagnosis of voice disorders. Clinicians rely on auditory perceptual assessments of voice production for monitoring changes in voice production that may reflect improvement or worsening of laryngeal pathology. The experienced clinician has developed the listening skills required to identify and discriminate voice characteristics. However, as studies have shown, a great deal of intrajudge and interjudge variability may preclude development of a reasonable listening instrument for the perceptual judgment of voice. 11, 12, 13, 14, 15, 16 The presence of such variability means that the clinicians at a hospital or clinic should train themselves to judge auditory perceptual parameters of voice (and speech production and visual perceptual parameters, for that matter) similarly. This is accomplished through listening to anchoring tapes that are periodically reviewed by the clinicians to realign internal listening standards and through reliability sessions in which the clinicians reach consensus on judging vocal parameters. 17
The collection of information for perceptual analysis usually consists of two portions: a standardized elicited task section and free conversation. The tasks are designed for the analysis of voice quality (rough, breathy, strained/strangled, aphonia, pitch breaks), pitch appropriateness and range, and loudness appropriateness and range. An s/z ratio (for an estimation of the relationship between lung volumes available for speech and glottic competence) can be calculated. To identify specific abusive voice production behaviors and to evaluate the presence of spasm or tremor, ask the patient to repeat target words or sentences (e.g., tasks like vowel-initial sentences, voiced/voiceless contrast sentences, and voiced continuant sentences). ▶ Table 12.2 lists some tasks that can be used in a protocol for perceptual analysis. Rating scales for perceptual evaluation of voice include the GRBAS scale as described by Hirano 18 and CAPE-V. 19
Task | Objective | Expected Behavior |
Sustained vowel | Judge voice quality, glottal competence s/z | Duration = 18–20 sec |
Sustained /s/ and /z/ | Ratio: estimate glottal efficiency | 1.4 or less |
Singing up the musical scale | Estimate speaking pitch range | 16 notes (2 octaves) |
Soft–loud voice production | Assess ability to vary loudness and produce a shout | Appropriate shout; adequate loudness, variation |
Oral reading: standard passage | Compare to sustained vowel/free conversation | Variations in pitch/loudness; adequate replenishing breaths |
Free conversation | Compare to sustained vowel/oral reading; assess effects of emotion on voice | As above for oral reading (with more inflection); voice production is consistent |
Coughing, throat clearing, laughter | Assess nonspeech vocal fold behavior | Sharp glottal coup |
Specific words/sentences; varying loudness and pitch | Elicit hard glottal attack, adductor/abductor spasm, tremor, seek variations in voice disorder | Absence of symptoms |
The GRBAS derives its name from the acronym for its five scales: grade (degree of hoarseness), rough (irregularity heard in vocal fold vibration—frequency or amplitude), breathy (breathiness or air turbulence), asthenic (weakness and/or decreased loudness), and strained (tight voice quality related to perceived hyperfunction). Each of these parameters is rated along a four-point scale: 0, normal; 1, slight; 2, moderate; and 3, extreme. This scale has been used internationally; however, there is no recognized standardization for general use.
The Consensus Auditory-Perceptual Evaluation of Voice (CAPE-V) is an instrument for the perceptual evaluation of voice quality. Six vocal attributes are rated along a 10-cm linear analogue scale: overall severity (global impression of voice quality), roughness (irregularity in voice), breathiness (air escapage in voice), strain (perceived hyperfunction in voice production), pitch (relative deviation from normal for the person’s age, gender, etc.), and loudness (relative deviation from normal for person’s age, gender, etc.). For each attribute, “consistent” or “intermittent” can be noted. In addition, there are two blank scales available for use for attributes like voice breaks and aphonia. The authors developed a protocol for collecting a voice sample for perceptual rating. They also emphasized the importance of standardizing voice collection techniques for all persons. The recommended tasks include sustained vowel production (/i/ and /a/), reading of six prescribed sentences, and at least 20 seconds of running spontaneous speech.
Assessing Severity
The severity of a voice disorder is relative to the perspective of the SLP and the patient. Studies comparing clinicians’ and patients’ ratings of voice disorder severity and impact on daily functioning typically demonstrate a disparity in the perceptions of these two groups. 20, 21, 22 Intuitively, this makes sense. Many factors contribute to how patients evaluate the effects of dysphonia on their lives. A person who is retired, lives alone, and has few social contacts may feel less handicapped by vocal fold immobility than another individual who has a more active social life and increased speaking demands. Perceptions of severity may even change as a patient moves through the continuum of care. For example, a patient who developed vocal process granulomas secondary to prolonged intubation for respiratory failure may report less handicap from dysphonia immediately after extubation due to pressing concerns regarding her unstable medical status. However, as her condition improves and she moves from the intensive care unit to a step-down unit to a regular medical floor, she may perceive her voice disorder as more severe as she attempts to communicate with family, friends, and medical staff.
Voice-Related Patient-Reported Outcomes
Measures that assess patient-reported outcomes (PROs) have gained recent prominence in the drive to collect relevant data for assessing treatment outcomes. Previously, they were considered ‘quality of life’ tools; the change in terminology reflects the emphasis on the patient perspective. Outcomes reflects to the shift in emphasis to data collection using these instruments for measuring the effects of treatment and procedures. We could argue that the ‘gold standard’ for evaluating the effectiveness of treatment is how the patient perceives and experiences the results of any intervention. Several standardized and nonstandardized tools are available for voice disorders. Llewellyn-Thomas and colleagues 21 were among the first to develop a series of scales for the assessment of the effects of radiation therapy on voice and daily functioning in laryngeal cancer patients. Patients judged their ability to use their voices in work and social situations as well as the quality of their voices. Smith et al 23 developed a questionnaire that collected information from patients regarding the functional impact of their voice disorder on aspects of their lives. Information on employment, symptoms, risk factors, and family history was also elicited. In this study, significant effects were reported for work activities and social interaction among older patients.
In 1997, Jacobson et al published the Voice Handicap Index (VHI), which was the first standardized instrument for assessing self-perceived handicap for patients with voice disorders. 24 The VHI is a 30-item scale with three subscales: physical, emotional, and functional. It was standardized on a diverse group of patients, including laryngectomees. A patient’s total score must change by 18 points (in either direction) to demonstrate a change in self-perceived handicap that is not related to random variation. Hogikyan and Sethuraman 25 developed the 10-item Voice-Related Quality of Life (V-RQOL) scale to measure similar aspects of self-reported changes in quality of life with voice disorders. A systematic review of available patient-reported outcomes measures (PROM) for individuals with voice disorders indicated that the VHI and the Voice Symptom Scale (VoiSS) met the most psychometric criteria considered for instrument construction. 26 See ▶ Table 12.3 for measures that are available for PROs. Within this category are scales that are shorter versions of existing instruments (e.g., VHI-10) as well as pediatric proxy scales (e.g., pVHI). It is clear that the development of sensitive, reliable, and valid tools for assessing quality of life and the effects of medical, surgical, and behavioral interventions is required not only to understand patients’ perception of their voice disorders, but also to respond to third-party payer demands for demonstrated treatment effectiveness. In addition to the current variety of measures that have been developed to use with adults and children as well as proxy or partner measures to use with parents and others, future directions for PROM include disorder-specific measures as well as instruments that are designed to capture particular cultural experiences.
Instrument | Authors |
Voice Handicap Index (VHI) | Jacobson et al 24 |
Voice Outcome Survey (VOS) | Gliklich et al 27 |
Vocal Performance Questionnaire (VPQ) | Carding et al 28 |
Voice-Related Quality of Life (V-RQOL) | Hogikyan & Sethuraman 25 |
Voice Activity and Participation Profile (VAPP) | Ma & Yiu 29 |
Pediatric Voice Outcome Survey (PVOS) | Hartnick 30 |
Voice Symptom Scale (VoiSS) | Deary et al 31 |
Voice Handicap Index-10 (VHI-10) | Rosen et al 32 |
Pediatric Voice-Related Quality of Life (PVRQOL) | Boseley et al 33 |
Voice Handicap Index-Partner (VHI-P) | Zraick et al 34 |
Pediatric Voice Handicap Index (pVHI) | Zur et al 35 |
Singing Voice Handicap Index (SVHI) | Cohen et al 36 |
Voice Disability Coping Questionnaire (VDCQ) | Epstein et al 37 |
The information obtained from the history and auditory perceptual analysis prepares the clinician for expected findings during instrumental voice analysis. Hypotheses formed during this initial phase can be tested and compared with acoustic, aerodynamic, and videostroboscopic findings.
The Clinical Voice Laboratory
Speech-language pathologists who specialize in voice have been intrigued for many years about the possibility of describing the voice in a more objective fashion. As hardware and software for measuring acoustic, aerodynamic, and laryngeal imaging parameters of voice production became more generally available for use in the clinic, SLPs began to develop protocols for collecting data to be used in the diagnosis of dysphonia and for measuring change in voice production due to various interventions. A bank of normative data was developed and SLPs could reasonably incorporate measures in their clinical practice. Currently, there are several centers in the United States that utilize the comprehensive instrumental assessment of voice. However, other clinicians who do not specialize solely in voice disorders have access to aspects of objective analysis and use these measures consistently. In either case, it is important to acknowledge the limitations of acoustic, aerodynamic, physiologic, and imaging measures in assessing laryngeal function. Titze 38 discussed the need for understanding the levels of observation that are available for vocal function and their limitations. Acoustic analyses performed by various applications of the same measure (e.g., jitter or frequency perturbation) are not always calculated by the same algorithm. Care must be taken when comparing measures between and across patients so that confounding factors do not interfere with the validity of the measures.
The data generated by instrumental measures of voice constitute the first step in the objective description of voice quality. The anatomy and physiology of the larynx and the mechanics of voice production can be examined indirectly through the use of instrumental vocal function measures, including acoustic analysis, aerodynamic measurement, tracing of laryngeal movement, and laryngeal imaging. Today, the clinical voice pathologist can employ several instrumental tools for assessment, treatment monitoring, and direct biofeedback of voice production ( ▶ Table 12.4). This complementary information improves understanding of the capabilities in normal and professional speakers and the limits of voice production in patients with disorders.
Technique | Information | Equipment and Function |
Acoustic recording and analysis | Fundamental frequency Intensity Signal/harmonics-to-noise ratio Perturbation measures Spectral features (spectrogram) Voice range profile/phonetogram | Microphone, speakers Digital recording system Computer Data storage and retrieval Acoustic analysis software |
Aerodynamic measurement | Airflow rate and volume Subglottal (intraoral) pressure Laryngeal resistance Phonation threshold pressure | Oral-nasal airflow mask Oral sensing tube Pneumotachometer or warm wire anemometer |
Laryngeal videostroboscopy | Vocal fold appearance Arytenoid motion Vocal fold vibration Glottal closure | Endoscopes (rigid, flexible) Stroboscopic light generator Audio and contact microphones Camera, lens Computer, monitor, color printer Digital storage |
Electroglottography (EGG) | Vocal fold contact area | Electroglottograph |
Electromyography (EMG) | Muscle activity, nerve function (RLN, SLN) | Electromyograph |
The clinical applications of these instruments have several purposes, including pathology detection, assessment of severity, differential diagnosis of a voice problem, and as a primary treatment tool. Objective measures of both vocal function and observation of the laryngeal image can be used by the voice pathologist to display, instruct, motivate, and justify treatment needs. Instrumental feedback may assist with achieving target behaviors. Repeated pre- and posttreatment measurements may reinforce the patient’s progress. Finally, information about the vocal pathology gathered through instrumental assessment offers an illustration or documentation of the pathology that may be more convincing than perceptual judgments of voice quality alone.
The user must always recognize that all noninvasive voice laboratory measurements are indirect estimates of various aspects of vocal function. One might make inferences about voice quality or laryngeal status using these measures. The only direct measure of vocal function is percutaneous electromyography. This invasive procedure requires collaboration with an otolaryngologist or neurologist in the clinical setting. With this in mind, the levels of observation that are represented by various measurement tools also dictate the limits of our interpretation of data. 38
Acoustic Analysis
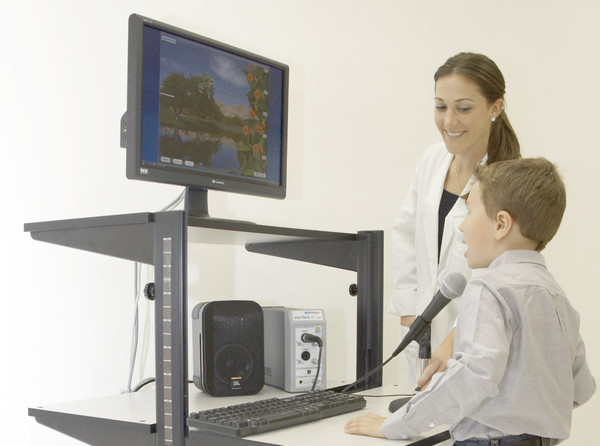
As Roy et al 10 noted, acoustic analysis has been used most frequently in the investigation of appropriate measures for clinical assessment of voice. These measures are quick and easy to collect and often this is the most used information in voice clinics where laryngeal imaging is not available. The visual and numerical output can be helpful for patients to understand the characteristics of their voices and allows for tracking change as a result of behavioral, medical, or surgical treatment. ▶ Fig. 12.1 shows a self-contained and readily available proprietary acoustic analysis system. ▶ Fig. 12.2 shows a system that is particularly tailored for therapy in adults and children, providing feedback about vocal performance. However, there are free programs available for download that require only a good microphone and adequate processing capacity for signal analysis. Typically, these systems are able to process only relatively steady-state signals; recordings of voices that are significantly rough or breathy may not be analyzed accurately. As with all objective voice analysis, it is important to elicit identical data across collection points.
Fig. 12.1 Acoustic analysis system. (Courtesy of KayPENTAX.)
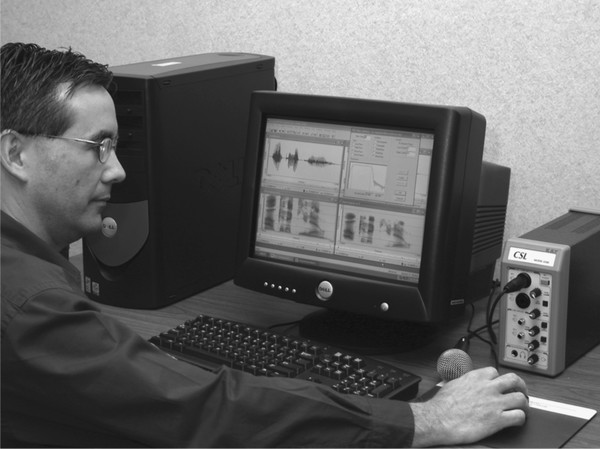
Fig. 12.2 Acoustic analysis system for behavioral therapy. (Courtesy of KayPENTAX.)
▶ Table 12.5 displays a sample recording protocol for acoustic measures.
Task | Measure |
Sustained vowel /i/ or /a/ (three trials each) | Fundamental frequency (Hz) |
At: Comfort/Habitual pitch | Jitter (%, msec) |
High pitch (excluding falsetto) Low pitch (excluding glottal fry) | Shimmer (dB)/Amplitude perturbation quotient (%) Harmonics-to-noise ratio |
Glissando (vowel glide from lowest point in pitch range to highest point) | Lowest F0 Highest F0 |
Soft to loud voice (count from 1 to 5) Recite passage | Lowest intensity (dB) Highest intensity (dB) Speaking fundamental frequency Habitual intensity (dB) |
Conversation | Speaking fundamental frequency |
Fundamental Frequency
Fundamental frequency (F0) is probably the most basic measure extracted from a live or recorded signal. F0 (the acoustic measure) relates to pitch (as we perceive it). It is measured in Hertz (Hz; cycles per second) and is easy for patients to understand as it relates directly to vocal fold vibration. We anticipate that most patients with benign lesions (e.g., polyps) that add mass to the vocal folds and thereby decrease habitual pitch, will exhibit a higher F0 after treatment. Maximum and minimum F0 levels are recorded as well. Some analysis programs will calculate speaking fundamental frequency, which is a measure of F0 produced during reading a passage. Most clinic protocols require three trials and then resulting measures are averaged.
Intensity
Intensity level (I0) refers to the perceptual characteristic of loudness. It is measured in decibels (dB). Most programs do not measure intensity with the standard reference to sound pressure level (SPL). They usually use a level that is standardized to an internal value. So, it is important to refrain from comparing intensity levels analyzed by one piece of equipment to those analyzed by another. For example, it is not appropriate to refer to intensity measured on the KayPENTAX Computerized Speech Lab (CSL) as equivalent to the level measured on a sound-level meter. In addition, several variables can influence intensity measures, such as ambient noise and type of microphone, as well as microphone-to-mouth distance. At the very least, microphone-to-mouth distance should be standardized in every clinic for every measure (especially intensity). This way, values can be compared meaningfully over time. As for frequency, intensity range can be calculated, as can variability over reading a passage.
Perturbation Measures
The measure of cycle-to-cycle variability in a particular sound signal (in our case, sustained vowel production) is called perturbation. Perturbation can be calculated for both frequency and intensity. Frequency perturbation is called jitter and intensity perturbation is called shimmer. Accurate analysis of an acoustic waveform for frequency and intensity perturbation relies on the integrity of the signal. Titze 39 described three basic types of acoustic signals that can occur for sustained vowels. He recommended analyzing these waveforms using the narrowband spectrogram function of an acoustic analysis system. Narrowband spectrograms filter the signal in such a way that the acoustic energy at the level of the vocal folds is relatively isolated. By examining the spectrogram, it is possible to determine the relative periodicity of the signal, which allows for more accurate analyses–particularly related to perturbation measures. Type 1 signals are periodic, with relatively low levels of sound energy (e.g., subharmonics) compared to the F0 energy. These are the most appropriate signals for most acoustic analyses. Type 2 signals do not always demonstrate a clear F0. Type 3 signals are ‘chaotic’ and present no signal regularity or periodicity so a computer algorithm will not be able to produce a reliable analysis. Some of the perturbation values for frequency include jitter (%), relative average perturbation (%), and pitch perturbation quotient (%). Perturbation values for intensity include shimmer (dB) and amplitude perturbation quotient (%). Some of these values are more stable than others, and it is important to determine the ones that will be most appropriate for the signal being analyzed. 40
Harmonics-to-Noise Ratio
A harmonics-to-noise ratio (HNR) is a calculation of the amount of relative periodicity in the acoustic signal generated at the vocal folds compared to the level of ‘noise’ in the signal. Other terms for this type of measure include signal-to-noise ratio and noise-to-harmonics ratio. It is important to understand that these are not necessarily equivalent ratios, as the algorithms will vary. Clinicians cannot compare results for HNR if they are not calculated on the same equipment. As for most acoustic analyses, HNR is best assessed using Type 1 signals.
Voice Range Profile
The voice range profile, also known as the phonetogram, has been used primarily by singing teachers and clinicians (phoniatricians, physicians who care for patients with voice disorders outside the United States) for some time. 41, 42 For most acoustic analysis programs, this is a relatively automatic procedure. The patient is guided through the production of softest and loudest voice at designated frequencies (from low to high). Analysis programs plot the results, which appear as semitones plotted in an elliptically shaped graph. This measure has been applied most commonly in singers and can be used to measure change over time. 43
Spectral Analyses
There are several types of spectral analysis available to the SLP. Choice of the appropriate analysis depends on the particular aspect of the acoustic signal under consideration. When examining a speech sample over time, the sound spectrogram allows for display of formants and consonant/vowel relationships (wideband) or energy concentrated at the vocal folds (narrowband). Frequency is displayed on the y-axis, time is displayed on the x-axis, and the intensity of each frequency is indicated by darkening (or colorization) of the image. The relative clarity of the plot can be used to illustrate the distinction between normal and dysphonic voice for patient education. As mentioned above, narrowband spectrograms are used to sort acoustic signals into Type 1, Type 2, and Type 3 categories. Other options for examining the interaction between frequency (x-axis) and intensity (y-axis) in the acoustic signal include fast Fourier transform (FFT), linear predictive coding (LPC), and long-term average spectrum (LTAS). FFT and LPC are used to assess vowel productions at a single point in time and LTAS is useful for connected speech.
Aerodynamic Analysis
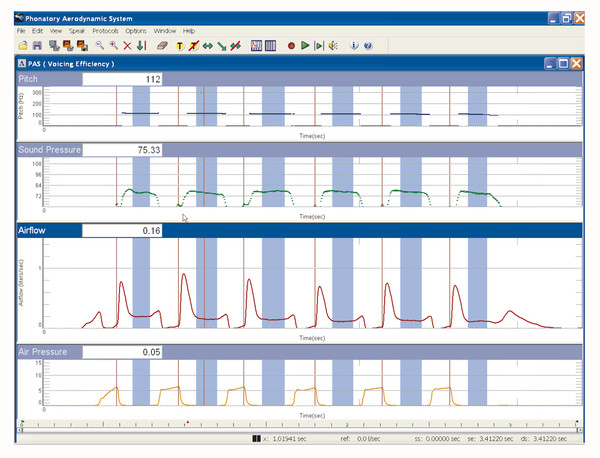
The broad category of aerodynamic analysis relates to measures that assess the degree and efficiency of vocal fold closure. Measures of airflow, subglottal pressure, phonation threshold pressure, and laryngeal resistance allow clinicians to infer the integrity of the glottal valve. ▶ Fig. 12.3 displays a widely available aerodynamic analysis system that can provide measures of airflow, subglottal pressure, laryngeal resistance, and glottal efficiency. ▶ Fig. 12.4 shows a representative display of measures obtained with this system.
Fig. 12.3 Aerodynamic analysis system. (Courtesy of KayPENTAX.)
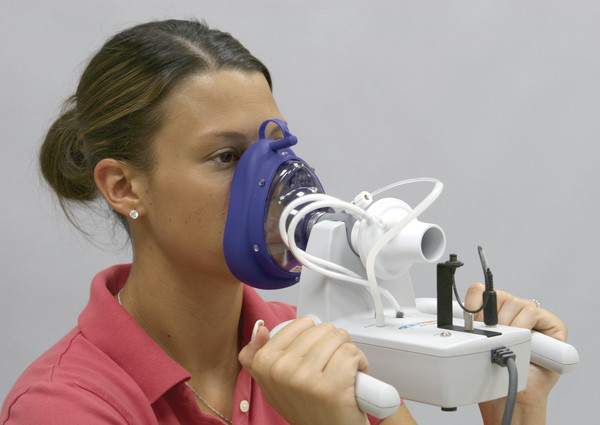
Fig. 12.4 Display of aerodynamic analysis system. (Courtesy of KayPENTAX.)
Aerodynamic analysis is susceptible to measurement errors similar to acoustic analysis. If the equipment is not properly calibrated, appropriate lip closure around tubing is not maintained, or facial mask coupling is not complete, measures with be inaccurate and not replicable. ▶ Table 12.6 displays a sample aerodynamic recording protocol.
Task | Measure |
Deep inhalation/slow exhalation (two trials) | Estimated vital capacity/flow volume |
Deep inhalation/fast exhalation (two trials) | Forced vital capacity |
Sustained vowel–/i/ or /a/ (three trials each) | Phonation volume |
Habitual pitch | Airflow rate |
Highest sustainable pitch (excluding falsetto) | Peak flow rate |
Lowest sustainable pitch (excluding glottal fry) | Phonation time |
/ipipipipi/ (on one exhalation) | Subglottal/intraoral pressure Glottal resistance Glottal efficiency Glottal power |
Flow Measurement
Measures of flow volume and flow rate allow for the collection of average values that can reflect the degree of glottal closure. Using lung volumes that are available for sustained phonation, airflow rate can be calculated by measuring the volume of air used for maximum sustained phonation. This value is expressed in milliliters/second. Consequently, a higher airflow rate indicates less vocal fold closure. This measure is quite useful for patients with vocal fold paralysis and, conversely, for patients who hyperadduct the vocal folds during phonation.
Subglottal Air Pressure Measurement
Subglottal air pressure is the driving force for vocal fold vibration. Insufficient pressure means that the vocal folds do not vibrate in a predictable and reliable way. For individuals with vocal fold lesions, scarring, or other pathologies that affect vocal fold mass, increased subglottal pressure is required to initiate phonation. Subglottal pressure is measured by inserting a needle into the trachea below the level of the vocal folds. Obviously, this is not an application for regular clinical use. Consequently, an indirect measure of pressure is derived by calculating the intraoral pressure produced when a tube is placed between closed lips. The speaker produces an /i/ + voiceless plosive + vowel sequence (e.g., /ipipipipi/). This is assumed to replicate the condition of subglottal pressure that builds just before vocal fold opening to initiate phonation. 44 The peak intraoral pressure is measured just before plosive release and is the surrogate value for subglottal pressure.
Phonation Threshold Pressure
Phonation threshold pressure (PTP) is the least tracheal pressure needed to initiate vocal fold oscillation. 45, 46 This measure has several potential applications for the investigation of effects of voice use and vocal fold pathology on the physiology of voice production. Solomon and DiMattia 47 found that a higher PTP was required to produce voice after a vocal fatiguing task. In addition, they reported that systemic hydration appeared to delay the increase in PTP.
Laryngeal Resistance
Laryngeal resistance is calculated by dividing peak intraoral pressure by the peak flow rate. The measure is elicited by asking the patient to produce /pipipipipipi/. 44 It is important that the patient produce the CV sequence from a mid lung volume so that the airflow rate is relatively stable throughout. Laryngeal resistance can indicate whether phonation is hyperfunctional or hypofunctional. However, when used to estimate degree of closure in some pathologies, airflow must be steady to result in a reliable measure. 48
Physiologic Measures of Voice Production
Electroglottography
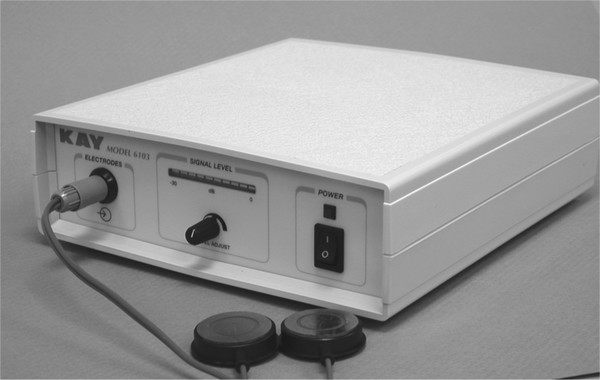
Electroglottography (EGG) is a method for measuring vocal fold contact area during sustained phonation. It is noninvasive. Contact electrodes are placed against the thyroid laminae, and a slight current moves between the electrodes; the resulting signal indicates the amount of contact area between the vocal folds. So, the more closure/contact, the greater flow of current. The tracing that results from EGG provides a good indication of the degree of closure. 49 This technique does not work well for patients with aperiodic vocal fold vibration or for patients with vocal fold paralysis. ▶ Fig. 12.5 shows a typical electroglottogram.
Fig. 12.5 Electroglottograph. (Courtesy of KayPENTAX.)
Stay updated, free articles. Join our Telegram channel

Full access? Get Clinical Tree


