Fig. 14.1
Targeting strategies for multivalent and multispecific proteins. Circles and squares represent individual binding sites that can be either identical (monospecific) or different (bispecific). Ligand can simultaneously bind: a two receptors on the same cell surface; b two epitopes on the same receptor; and c two receptors on separate surfaces or in solution
In this section, we present the basic kinetic and thermodynamic models for ligand–receptor binding, beginning with a monovalent interaction and expand these models to include multivalency. More detailed analyses are offered in various textbooks and reviews as cited; this introduction should give the reader a sense of the physical factors contributing to the advantageous properties of multivalent proteins, and how information from these models can guide the design and engineering of protein therapeutics.
14.2.1 Equilibrium Binding Constant, K D
A monovalent binding interaction between a therapeutic protein, which we call ligand (L), and the target molecule, which we call receptor (R), is described by the following equation:

where LR represents the 1:1 complex of L and R, and k on and k off are the rate constants for association and dissociation, respectively. The association and dissociation rates are defined as follows:
![$$ r_{\text{association}} = k_{\text{on}} [L][R] $$](/wp-content/uploads/2017/03/A305812_1_En_14_Chapter_Equ2.gif)
![$$ r_{\text{dissociation}} = k_{\text{off}} [LR] $$](/wp-content/uploads/2017/03/A305812_1_En_14_Chapter_Equ3.gif)

(14.1)
![$$ r_{\text{association}} = k_{\text{on}} [L][R] $$](/wp-content/uploads/2017/03/A305812_1_En_14_Chapter_Equ2.gif)
(14.2)
![$$ r_{\text{dissociation}} = k_{\text{off}} [LR] $$](/wp-content/uploads/2017/03/A305812_1_En_14_Chapter_Equ3.gif)
(14.3)
At some time after the start of the reaction, the system reaches equilibrium concentrations of L, R, and LR, reflecting the relative values of k on, k off, and the initial concentrations of L and R: ![$$ \frac{{{\text{d}}\left[ L \right]}}{{{\text{d}}t}} = \frac{{{\text{d}}\left[ R \right]}}{{{\text{d}}t}} = \frac{{{\text{d}}\left[ {LR} \right]}}{{{\text{d}}t}} = 0 $$](/wp-content/uploads/2017/03/A305812_1_En_14_Chapter_IEq1.gif) . The concentrations of free L and R, and LR remain in a dynamic equilibrium, in that r association = r dissociation. We can therefore say that:
. The concentrations of free L and R, and LR remain in a dynamic equilibrium, in that r association = r dissociation. We can therefore say that:
![$$ k_{\text{on}} \left[ L \right]_{\text{eq}} \left[ R \right]_{\text{eq}} = k_{\text{off}} \left[ {LR} \right]_{\text{eq}} $$](/wp-content/uploads/2017/03/A305812_1_En_14_Chapter_Equ4.gif)
which can be rearranged to:
![$$ \frac{{k_{\text{off}} }}{{k_{\text{on}} }} = \frac{{\left[ L \right]_{\text{eq}} \left[ R \right]_{\text{eq}} }}{{\left[ {LR} \right]_{\text{eq}} }} $$](/wp-content/uploads/2017/03/A305812_1_En_14_Chapter_Equ5.gif)
![$$ \frac{{{\text{d}}\left[ L \right]}}{{{\text{d}}t}} = \frac{{{\text{d}}\left[ R \right]}}{{{\text{d}}t}} = \frac{{{\text{d}}\left[ {LR} \right]}}{{{\text{d}}t}} = 0 $$](/wp-content/uploads/2017/03/A305812_1_En_14_Chapter_IEq1.gif) . The concentrations of free L and R, and LR remain in a dynamic equilibrium, in that r association = r dissociation. We can therefore say that:
. The concentrations of free L and R, and LR remain in a dynamic equilibrium, in that r association = r dissociation. We can therefore say that:![$$ k_{\text{on}} \left[ L \right]_{\text{eq}} \left[ R \right]_{\text{eq}} = k_{\text{off}} \left[ {LR} \right]_{\text{eq}} $$](/wp-content/uploads/2017/03/A305812_1_En_14_Chapter_Equ4.gif)
(14.4)
![$$ \frac{{k_{\text{off}} }}{{k_{\text{on}} }} = \frac{{\left[ L \right]_{\text{eq}} \left[ R \right]_{\text{eq}} }}{{\left[ {LR} \right]_{\text{eq}} }} $$](/wp-content/uploads/2017/03/A305812_1_En_14_Chapter_Equ5.gif)
(14.5)
The subscript “eq” indicates that the concentrations are at equilibrium. The ratio of k off over k on describes the strength of the interaction and is defined as the equilibrium binding constant (K D ) of L and R.
![$$ K_{D} = \frac{{k_{\text{off}} }}{{k_{\text{on}} }} \left[ = \right]{\text{mole}}/L $$](/wp-content/uploads/2017/03/A305812_1_En_14_Chapter_Equ6.gif)
![$$ K_{D} = \frac{{k_{\text{off}} }}{{k_{\text{on}} }} \left[ = \right]{\text{mole}}/L $$](/wp-content/uploads/2017/03/A305812_1_En_14_Chapter_Equ6.gif)
(14.6)
As shown in Eqs. 14.5 and 14.6, the K D represents the ratio of the individual concentrations of L and R to the concentration of the LR complex at equilibrium. From this definition, a lower K D corresponds to stronger binding affinity, while a higher K D corresponds to weaker binding affinity. Measurements of K D, k on, and k off provide common metrics for describing the binding affinity and kinetic binding parameters of a molecular interaction. These properties can play a direct role in the biological efficacy of a protein therapeutic [14–16]. Thus, there has been great interest in determining the relationships between binding affinity and biological function, and how alterations in these parameters can be leveraged in protein engineering to direct a biological outcome. Figure 14.2 illustrates the effect of K D on the percent of R converted to LR at equilibrium, for a range of L concentrations. Typical K D values range from μM for enzyme–substrate interactions, to nM and pM for cell surface receptor binding events, and even fM in rare cases such as biotin–streptavidin, underscoring how nature has optimized binding affinities for different biological contexts.
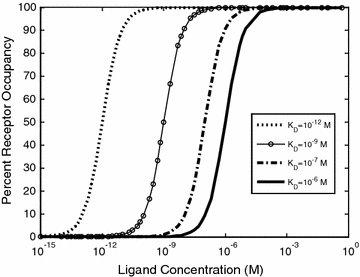

Fig. 14.2
Ligand–receptor binding for a range of K D values
14.2.2 Thermodynamic Considerations in Binding
The laws of thermodynamics dictate protein biophysical properties, including folding, structure, and binding energetics. Our discussion on thermodynamics will be centered around the Gibbs free energy (∆G) of binding, which can be thought of as the energy (kcal/mol) gained from or lost to the environment in a binding event. Studies of protein–protein interactions often explore how altering amino acid sequence and protein structure affects ∆G, consequently identifying important molecular contributions to binding affinity. The following equation relates the Gibbs free energy to the K D :

where R is the ideal gas constant, with units of kcal/(mol * K). The same equation can be rearranged to obtain:


(14.7)

(14.8)
The implication of Eqs. 14.7 and 14.8 is that the binding affinity is dependent on the energetics of binding as well as temperature. Here, a negative ∆G indicates an energetically favorable binding reaction that will spontaneously proceed in the forward direction, and a positive ∆G indicates an unfavorable one. The simplest way to understand the relationship between energetics and kinetics is through a reaction coordinate diagram, as shown in Fig. 14.3.
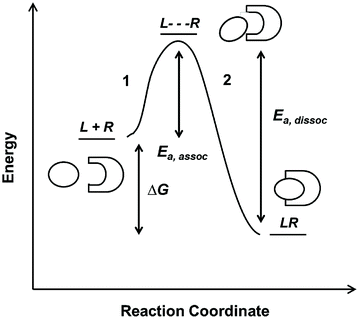

Fig. 14.3
Reaction coordinate diagram of a monovalent binding interaction
On the reaction coordinate, the relative energies of free L and R and the complex LR are measured as ∆G. The LR complex state must be lower in energy than the free states in order for the binding interaction to be favorable. This corresponds to a negative sign for ∆G if defined as G complex − G free. The curve represents the reaction pathway and is indicative of the equilibrium amounts of L, R, and LR as defined by the K D value. In this case, the binding event is comprised of two steps. The first step (1), which requires some starting energy E a,assoc, arranges the ligand and receptor an optimal position and conformation for binding. The starting energy E a,assoc arises from thermal fluctuation of the molecules in solution. In the second step (2), the LR complex formation releases an energy that drives the binding interaction forward. The same principles drive the dissociation reaction (with an E a,dissoc = E a,assoc + ∆G), until the system reaches equilibrium between the two states. The relative amount of energy E a,assoc or E a,dissoc required for association or dissociation, respectively, determines the probability of the molecules to successfully move forward or backward on the coordinate diagram. This probability is reflected in the rate constants, and hence K D . In reality, protein–protein interactions are often more complicated than the simple curve and two-step reaction illustrated above; for example, a reaction mechanism may contain multiple intermediate steps or require cofactors to facilitate ligand–receptor binding. However, the reaction coordinate provides good intuitive understanding of binding energetics and kinetics.
We can now further describe ∆G of binding in more physical terms, namely ∆H (enthalpy), temperature, and ∆S (entropy) of binding. Note that both ∆H and ∆S are state functions, meaning that regardless of the simplicity or complexity of the reaction mechanism, their values depend only on the relative energies between the free (initial) and complexed (final) states.


(14.9)
Formally, enthalpy is defined as the sum of internal energy of a system (energy required to create the system) and the work the system exerts on its surroundings. In the context of protein–protein interactions, we can think of enthalpy as a measure of the electrostatic and geometric complementarity between two proteins. Enthalpic contributions consist of molecular interactions of both binding partners that facilitate stronger noncovalent binding, as well as molecular interactions between the proteins and the surrounding environment. A negative ∆H value indicates an exothermic reaction (binding releases energy) while a positive ∆H value indicates an endothermic reaction (binding requires energy). Since a favorable binding event necessitates a negative ∆G value, a larger negative ∆H value correlates with better complementarity between the two binding partners.
Entropic contributions describe changes in the degrees of freedom of movement of L, R, and their surrounding solvent upon binding. In order to form an LR complex, L and R must adopt optimal conformations relative to each other, reducing the entropy of both proteins (S final − S initial < 0); from Eq. 14.9, we see that this results in a negative ∆S value, leading to a more positive, and therefore less favorable ∆G value. To better explain entropy, we divide ∆S into more specific subtypes [17–20]:


(14.10)
Translational and rotational entropy describes the protein’s ability to move in three-dimensional space. In nature, the reduction of translational degrees of freedom is necessary for facilitating many biological processes; a canonical example is the movement of proteins along DNA [21]. In our monovalent binding example, LR complex formation restricts the movement of ligand L to a particular volume occupied by the receptor R, and vice versa. Conformational entropy describes the protein’s thermal fluctuations around its native state. This idea is based on the prevalent view that free ligand and receptor are able to sample a range of orientations around their primary native states, which are optimal for binding to each other. In the context of Fig. 14.3, one could imagine many slightly different free protein conformations at various energies, with an average energy as indicated by the horizontal line at L + R. Upon binding, the primary conformations of both ligand and receptor are stabilized, greatly reducing their accessibilities to the initial range of conformations. Solvation entropy refers to the energy required to arrange water molecules around each other and around a protein. Upon protein binding, formation of the binding interface reduces the surface area between protein and water. Given that water molecules experience the greatest entropy when they are allowed to arrange around each other, protein binding results in a positive change in solvation entropy.
This representation shows that manipulations of enthalpy and entropy alter the free energy, and hence the binding affinity, of a given protein toward its intended target molecule [22, 23]. To enhance enthalpic contributions one might, for example, mutate amino acid residues within a binding interface to increase the charge or size complementarity. However, these effects are difficult to predict a priori using rational design; changes in the enthalpy of a protein–protein interaction often have unintended effects on entropy, and vice versa, all of which influence the K D value [19, 24].
14.2.3 Binding Avidity
We now extend the kinetic model to the case of a bivalent protein ligand; models describing proteins of higher order valency will follow the same principles outlined below. Bivalency increases the complexity of ligand–receptor binding kinetics through the physical tethering of one binding site in close proximity to another. The ligand is now a molecule containing two binding sites, each binding to one receptor molecule on a cell surface. Hence, the binding equation is altered as follows:


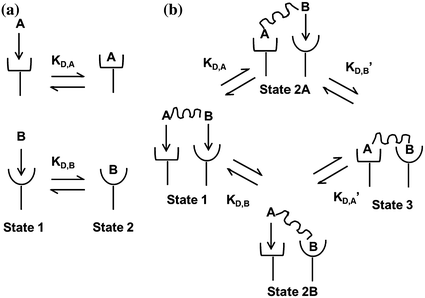
where k on,bi and k off,bi are the apparent rate constants of the bivalent ligand to the receptor. The term apparent is used to indicate empirically determined parameters that cannot distinguish between the individual receptor binding events of each ligand component. Often, there is an increase in the apparent affinity of a bivalent protein compared with the affinities of its monovalent components, a phenomenon known as avidity. To illustrate this point, we introduce the sequential binding reactions shown in Fig. 14.4, a concept originally proposed by Jencks [25]. In this schematic, ligands A, B, and A—B are free-floating, while their receptors are constrained to a surface (i.e., cell membrane) at a certain density. A and B can be identical (monospecific ligand) or different (bispecific ligand); the analysis is the same regardless of their identities. First consider Fig. 14.4a, where the binding sites A and B are untethered. In this case, the receptor binding events are independent monovalent interactions that can be described by Eq. 14.12. Hence, the interactions of A and B with their receptors are defined by their affinities K D,A and K D,B , respectively.

(14.12)

(14.13)

Fig. 14.4
Binding schematic of ligands A and B with their respective receptors. a Untethered A and B bind receptors independent of each other with affinities K D,A and K D,B . b Tethered A—B binds receptors in multiple states. State 1: both binding sites are unattached. State 2a,b: either A or B binds independent of the other with affinities K D,A and K D,B . State 3: second binding event depends on the first. Either A or B binds with affinities K D,A ′ and K D,B ′. Figure adapted from Jencks [25]
Now, we consider the more complex scenario in Fig. 14.4b, where A and B are tethered. The binding of the first site, whether it be A or B, to its target receptor follows the same monovalent binding kinetics as in Fig. 14.4a (State 1) and assumes that the binding events are independent. Below we present the binding equations of State 1 going to State 2:


(14.14a)

(14.14b)
In Eqs. 14.14a and 14.14b, the receptors are represented as R A − R B to indicate that they are on the same cell surface. In State 2, one ligand binding site is bound to a receptor, and thus, the cell surface, while the other is brought to the surface but still unbound. The second binding site is thus constrained to a volume defined by the space available to the linker joining A and B (State 2a and 2b). Although only one of the binding sites is bound to a receptor, the second binding site is more favorably placed near its receptor, increasing its probability of undergoing a binding interaction. In effect, we have transitioned from an intermolecular binding event to an intramolecular binding event [18, 26] as described by Eqs. 14.15a and 14.15b.


(14.15a)

(14.15b)
How do the apparent affinities K D,A ′ and K D,B ′ differ from the monovalent affinities K D,A and K D,B ? If we look at the binding events that occur from State 2 to State 3, we see that the effective concentration of the second binding site around free receptors has dramatically increased (Fig 14.5). It is important to recognize that this effective concentration can be orders of magnitude greater than the concentration of free ligand in solution, to the point where K D,A ′ ≪ K D,A and K D,B ′ ≪ K D,B . In other words, at equilibrium, the dominant species in solution are those in 14.15a and 14.15b representing State 2 and State 3. This phenomenon explains the avidity effect: when the effective concentration of the second ligand is so large that it drives the subsequent association reaction forward, the rate of complete dissociation of the ligand from the cell surface is greatly reduced compared with that of monovalent binding interactions.
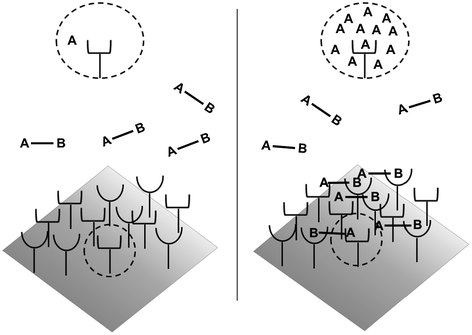

Fig. 14.5
Avidity effects due to increased effective concentration. Left: Before binding, the concentration of binding sites as seen by a cell surface receptor is equivalent to the ligand concentration in solution. Right: Upon monovalent binding of site B, the effective concentration of binding site A seen by the receptor is vastly increased, driving the association reaction forward
Now, we relate increased effective concentration to increased overall affinity due to bivalency. C eff is a term describing the enhancement of effective concentration of either A or B due to their tethering [19, 26]. We define C eff as the ratio of the ligand–receptor affinity of the monovalent binding event compared with their apparent affinity in a bivalent binding event:


(14.16)
If C eff > 1 M, the bivalent protein has an increased apparent affinity to the cell surface due to avidity effects. This sequential binding event can be represented by an overall affinity K D,AB,bi.


(14.17)
Since the reaction going from State 2 to State 3 is unimolecular, K D,A ′ and K D,B ′ are unitless. K D,AB,bi therefore has units of M.
Avidity can increase the apparent affinity of a multivalent ligand to be orders of magnitude greater compared with that of its monovalent components. As such, multivalency is a common phenomenon exploited by nature to enhance the affinities of protein ligands to their binding partners, eliminating the need to produce large amounts of monovalent protein or to evolve a single binding domain with high affinity. As examples, many growth factors utilize multivalency to achieve overall binding affinities in the nM–pM range. Vascular endothelial growth factor (VEGF) is a disulfide-linked homodimer that binds to two VEGF-receptor 2 (VEGFR2) molecules on the cell surface and induces their dimerization, stimulating downstream cell-signaling pathways [27, 28]. The strong affinity of VEGF for its receptor is in part due to its bivalent binding properties; when one VEGFR2-binding site was eliminated through directed mutagenesis, the affinity of VEGF was reduced by two orders of magnitude [28]. Hepatocyte growth factor (HGF) is a multidomain-soluble ligand that also binds to and dimerizes its cognate receptor (c-MET) with pM affinity [29]. Recent studies have shown that individual domains of HGF contribute weakly to c-MET binding, resulting in overall avidity effects when all domains are present [30, 31]. As a further demonstration of avidity effects in this system, a truncated HGF fragment termed NK1, despite its ability to dimerize the receptor, binds c-MET with a reduced affinity (nM) and is orders of magnitude less efficacious in inducing c-MET activation compared to HGF [30, 32]. In the context of protein therapeutics, the most well-studied natural multivalent protein is the antibody. Antibodies are modular, containing a constant (Fc) domain that mediates immune system activity, and two identical antigen-binding regions consisting of heavy and light variable chains. Natural antibodies are bivalent, but monospecific, in that these two antigen binding sites interact with the same target. Antibodies have been specifically evolved, either by nature or in the laboratory, for high-affinity recognition of a wide range of antigen targets and thus are applicable across a broad spectrum of medical problems [9, 10, 33].
14.2.4 Linkers and Avidity
Designing multivalent proteins with the desired kinetic properties can be carried out by: (1) engineering the binding sites themselves, (2) optimizing the linker that tethers the monovalent components, if applicable, or (3) both. Methods for altering protein–protein interactions have been extensively reviewed, and include both rational design and directed evolution [2–7]. In addition, much effort has gone into linker development, as optimal flexibilities and length requirements differ among systems [34, 35]. Linkers can strongly influence the avidity of multivalent protein interactions through entropic effects, and thus, their optimization is essential for achieving desired levels of therapeutic efficacy. In this subsection, we will describe the relationship between linker entropy and ligand-binding kinetics.
To introduce linker thermodynamics, we will use a polymer chain as an example of a model linker. Linkers can assume many different geometries and chemical compositions but are often linear peptide chains of varying length [36]. Entropy demands that the linker exist in random orientations in solution; this randomness is caused by thermal fluctuations. However, there is a deformation cost to bending that opposes entropy. This property, which depends on linker composition, is referred to as its elasticity. To illustrate this concept, we introduce a parameter called the persistence length L P , whose informal definition is the length over which a polymer strand is relatively straight, and is a measure of the strand’s elasticity or rigidity. Formally, it is the ratio of the linker’s elastic energy over thermal energy. A small L P indicates a flexible strand since the deformation cost is easily overcome by thermal fluctuations. Similarly, a large L P indicates a rigid strand, since the deformation cost is large, and the strand is not easily bent to different conformations. In Fig. 14.6, we present three different views of a polymer strand: at length l ≪ L P , the strand looks perfectly straight; at l ≈ L P , the polymer is still relatively straight, but one sees the initial deformation of the strand; at l ≫ L P , the linker can now be seen as a collection of rigid segments of length L P where the hinges allow each segment freedom of translation and rotation, and linker orientation can be approximated as a random walk in three dimensions.
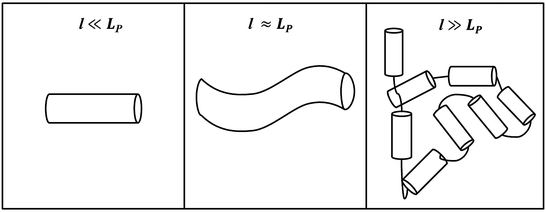

Fig. 14.6
Polymer chain at three different length scales. As l increases, deformation of the chain by thermal fluctuations randomizes the orientation
To understand the mechanism of how linkers influence binding affinity, we will explore avidity effects in the context of thermodynamics. The binding of the first site in Fig. 14.4b (State 1) lowers the translational, rotational, and conformational freedom of both molecules in the complex, represented by ∆S (see Eq. 14.10). As a result, the effective concentrations of the other ligand-binding sites are increased; in other words, the translational and rotational space that the tethered sites can sample is restricted to a smaller volume around their receptors. Thus, the entropic penalty for constraining any tethered binding site and its receptor in proximity with each other is paid to an extent by the binding of the first ligand. The ∆G of binding is therefore decreased for any subsequent interaction, lowering the apparent K D for a multivalent ligand compared with that of a monovalent ligand. The requirement for avidity is thus  [18], where ∆G multi,N is the total energy loss upon binding of the multivalent ligand with valency N, and ∆G 1,mono is the total energy loss upon binding of an independent monovalent site 1. Linker length and elasticity determines the magnitude of entropy loss for each binding event between a multivalent ligand and receptors on a surface. On the simplest level, the longer and more flexible the linker is, the greater the entropic penalty paid for each subsequent binding event. To illustrate this concept, we expand our polymer chain model to include identical ligand-binding sites (represented by ●) interspersed along a chain of length l ≫ L P (Fig. 14.7). Each chain segment has several degrees of freedom from the translational, rotational, and conformational contributions to entropy. Therefore, each binding event results in an entropy loss for the linker as well as for the ligand binding site and receptor. In Fig. 14.7, the first binding event on the left pays the majority of the entropic penalty and localizes the entire ligand in proximity to other receptors. Although subsequent binding interactions will also incur entropy losses for the linker and ligand-binding sites, these losses decrease for each additional binding event. If these entropic losses are less than the energy necessary to bring each monovalent binding site from solution to the receptor, the overall ∆G multi,N is still lower than the sum of N separate ∆G●, mono and there will be an avidity effect. However, if the linker is too elastic or too long, the overall entropic penalty for binding the entire ligand increases, as would ∆G multi,N . In this case, avidity would decrease, resulting in a weaker binding affinity. If the overall entropic penalty increases to the point where ∆G multi , N = N∆G●,mono, then no avidity effect will be observed.
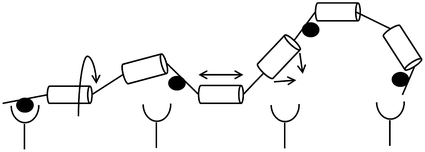
 [18], where ∆G multi,N is the total energy loss upon binding of the multivalent ligand with valency N, and ∆G 1,mono is the total energy loss upon binding of an independent monovalent site 1. Linker length and elasticity determines the magnitude of entropy loss for each binding event between a multivalent ligand and receptors on a surface. On the simplest level, the longer and more flexible the linker is, the greater the entropic penalty paid for each subsequent binding event. To illustrate this concept, we expand our polymer chain model to include identical ligand-binding sites (represented by ●) interspersed along a chain of length l ≫ L P (Fig. 14.7). Each chain segment has several degrees of freedom from the translational, rotational, and conformational contributions to entropy. Therefore, each binding event results in an entropy loss for the linker as well as for the ligand binding site and receptor. In Fig. 14.7, the first binding event on the left pays the majority of the entropic penalty and localizes the entire ligand in proximity to other receptors. Although subsequent binding interactions will also incur entropy losses for the linker and ligand-binding sites, these losses decrease for each additional binding event. If these entropic losses are less than the energy necessary to bring each monovalent binding site from solution to the receptor, the overall ∆G multi,N is still lower than the sum of N separate ∆G●, mono and there will be an avidity effect. However, if the linker is too elastic or too long, the overall entropic penalty for binding the entire ligand increases, as would ∆G multi,N . In this case, avidity would decrease, resulting in a weaker binding affinity. If the overall entropic penalty increases to the point where ∆G multi , N = N∆G●,mono, then no avidity effect will be observed.
Fig. 14.7


Entropy losses from constraint of a flexible linker. Circles (●) represent ligand-binding sites, while cylinders represent rigid segments of a flexible linker. Arrows indicate degrees of freedom of movement for the polymer chain; each segment can undergo rotation (left), extension (middle), and bending (right)
Stay updated, free articles. Join our Telegram channel

Full access? Get Clinical Tree


