This chapter is designed to acquaint the reader with bodily fluids that are frequently analyzed in the clinical chemistry laboratory. The source, method of collection, physiologic purpose, and clinical utility of laboratory measurements for each of these body fluids are emphasized.
CEREBROSPINAL FLUID
Cerebrospinal fluid (CSF) is the liquid that surrounds the brain and spinal cord. The brain and spinal cord are covered by the meninges that consist of three layers: the dura mater, arachnoid, and pia mater (Fig. 29.1). The CSF flows between the arachnoid mater and the pia mater in an area referred to as the subarachnoid space. The three functions of the CSF are (1) physical support and protection, (2) provision of a controlled chemical environment to supply nutrients to the tissues and removal of wastes, and (3) intracerebral and extracerebral transport (Fig. 29.2).
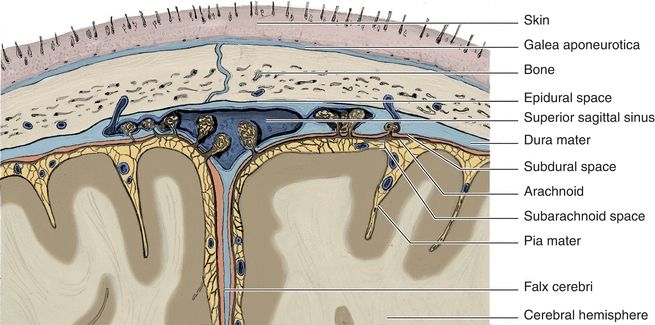
FIGURE 29.1 Meninges of the brain.
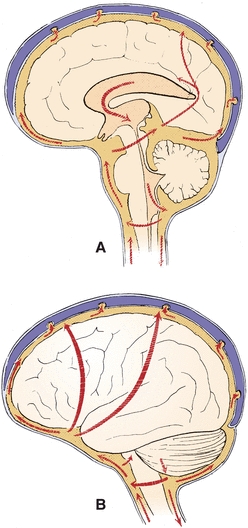
FIGURE 29.2 Major pathways of CSF. (A) Sagittal view. (B) Lateral view. (Reprinted from Milhorat TH. Hydrocephalus and the Cerebrospinal Fluid. Baltimore, MD: Lippincott Williams & Wilkins; 1972:25, with permission.)
The major and most obvious function of CSF is as a buoyant cushion for the brain. The denser brain floats in the less dense fluid, allowing movement within the skull. The significance of the cushion function is demonstrated by the result of a blow to the head. The initial shock is transferred to the entire brain, instead of inflicting damage to one area. The brain may be bruised at the side opposite the blow, depending on the force imparted.
The second major function of CSF is the maintenance of a constant chemical matrix for the CNS. Serum components may vary greatly, but constituent levels of CSF are maintained within narrow limits.
The transport function is described as a neuroendocrine role. The CSF is involved in the distribution of hypophyseal hormones within the brain and the clearance of hormones from the brain to the blood.
The total CSF volume is about 150 mL or about 8% of the total CNS cavity volume. The fluid is formed predominantly at the choroid plexus deep within the brain and by the ependymal cells lining the ventricles. The endothelial cells of the choroid plexuses have very tight-fitting junctures to control the passage of substances across their membranes. This is termed the blood–brain barrier. Damage to the blood–brain barrier is frequently the reason for abnormal chemistry results in CSF analysis.
CSF is formed at an average rate of about 0.4 mL/min or 500 mL/d. Formation is a result of selective ultrafiltration of plasma and active secretion by the epithelial membranes. Absorption of CSF occurs at outpouchings in the dura called arachnoid villi, also known as granulations, that protrude through the dura to the venous sinuses of the brain and into the bloodstream. The granulations act as one-way valves to maintain an excretion volume equal to the production volume.
Specimens of CSF are obtained by lumbar puncture, usually at the interspace of vertebrae L3 to L4 or lower, using aseptic technique (Fig. 29.3). The fluid obtained is usually separated into three numbered aliquots: (1) for chemistry and serology, (2) for microbiology, and (3) for hematology. In some instances, a fourth tube may be collected for cytology analysis. The order of the tubes reflects the presumed order for minimization of interference from less than optimal collection technique, with tube 3 presumably least contaminated by cells of intervening tissue. It is paramount to remember that this specimen is of limited volume and should be analyzed immediately. Any remaining sample should be preserved because of its limited availability.
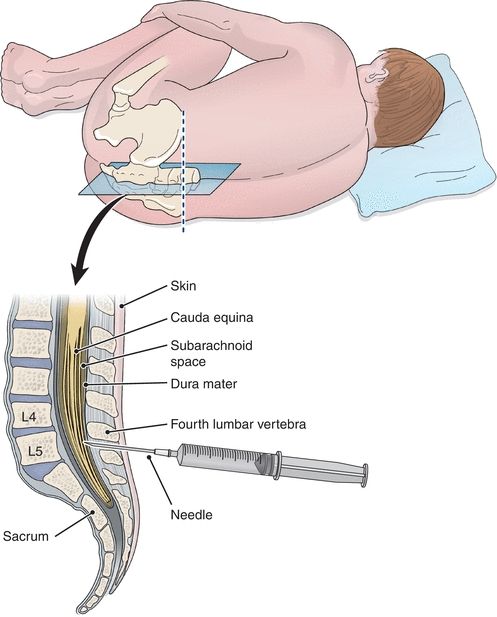
FIGURE 29.3 Placement of the needle for CSF collection.
Laboratory investigation of CSF is indicated for cases of suspected CNS infection, demyelinating disease, malignancy, and hemorrhage in the CNS. As with all patient samples entering the laboratory, physical examination of the specimen is the first and often the most important observation made. Normal CSF is clear, colorless, free of clots, and free of blood. Differences from these standards indicate a probable pathology and merit further examination. Cloudy fluids usually require microscopic examination, with a yellow to brown or red color indicating the presence of blood.
The two most common reasons for blood and hemoglobin pigments to be found in CSF are traumatic tap and subarachnoid hemorrhage. Traumatic tap is the artifactual presence of blood or derivatives due to interdiction of blood vessels during the lumbar puncture. Hemorrhage results from a breakdown of the barrier of the CNS and circulatory system from trauma, for example. Because of the life-threatening complications associated with hemorrhage, it must be differentiated from traumatic tap.
There are several ways to differentiate a traumatic tap from a subarachnoid hemorrhage. The first method involves comparing the amount of blood present between the collected tubes. If there is a significant difference in the amount of blood present between the first and last tubes collected (i.e., later tubes gradually clearing and less bloody), then the puncture was traumatic. If all tubes collected show the same degree of blood, then a subarachnoid hemorrhage is most likely. Figure 29.4 demonstrates the difference in appearance of normal clear CSF, red CSF in hemorrhage, xanthochromic CSF from an old hemorrhage, and CSF from a traumatic tap.1
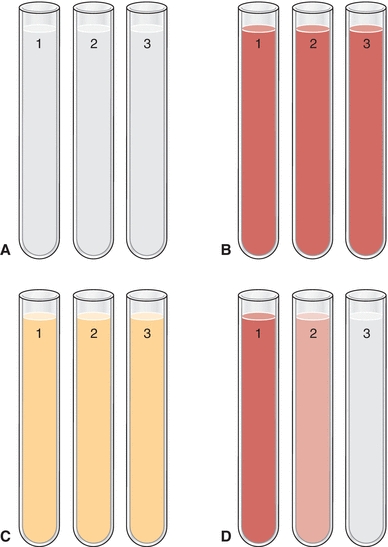
FIGURE 29.4 Comparison of CSF appearance between (A) normal CSF (all three tubes with the same clarity), (B) red CSF from fresh hemorrhage (all three tubes with the same red color and opaqueness), (C) xanthochromic CSF from old hemorrhage (all three tubes with the same yellow color and clear), and (D) CSF from a traumatic tap (decreasing amounts of redness in each successive tube). Note: Full color image on thePoint at http://thepoint.lww.com/.
A second method of discriminating between a traumatic tap and subarachnoid hemorrhage involves comparison of the appearance of the CSF precentrifugation and postcentrifugation. If the supernatant of the postcentrifugation sample appears colorless, the presence of blood is likely due to a traumatic tap. If the supernatant appears pink, red, or xanthochromic, hemorrhage should be suspected. This is due to red blood cells lysing easily in CSF due to the low level of proteins and lipids compared to that of plasma. The resultant in vivo hemolysis causes the release of free oxyhemoglobin that eventually changes to methemoglobin, and then after about 12 hours, bilirubin is formed (accounting for the xanthochromia). Gradual decrease in CSF color after a hemorrhage occurs over the first 2 days, clearing in about 2 to 4 weeks.2
Differentiation of a traumatic tap from a hemorrhage may also involve checking for the presence of a clot and/or hemosiderin-containing macrophages. Samples exhibiting signs of a traumatic tap may have clots present within the CSF and will exhibit no hemosiderin. Conversely, samples from a patient experiencing a subarachnoid hemorrhage will show no signs of fibrin clots but may contain hemosiderin-laden macrophages.
A wide variety of biochemical markers with CSF samples may be measured. However, in routine practice, the number of useful indicators involves only four analytes. The tests of interest are glucose, protein (total and specific), lactate, and glutamine. Before any chemical analysis, the sample should be centrifuged to avoid contamination by cellular elements.
Glucose enters the spinal fluid predominantly via a facilitative transport compared with a passive (diffusional) or an active (energy-dependent) transport. It is carried across the epithelial membrane by a stereospecific carrier species. The carrier mechanism is responsible for transport of lipid-insoluble materials across the membrane into the CSF. Generally, this is a “downhill” process consistent with a concentration gradient. This mechanism causes the CSF glucose concentration to be about two-thirds that of plasma.
Due to its dependence on plasma glucose concentrations, an isolated CSF glucose concentration may be misleading, and it is recommended that a plasma sample be obtained 2 to 4 hours prior to the tap so that plasma and CSF glucose levels can equilibrate. Normal CSF glucose is considered to be 60% to 70% that of the blood glucose. Increased glucose levels are not clinically significant, usually providing only confirmation of hyperglycemia. It is important to note that as hyperglycemia progresses and exceeds 600 mg/dL, the CSF glucose level does not remain at 60% to 70% of plasma values most likely due to cellular carriers being saturated and incapable of further transport. This saturation will cause the plasma/CSF glucose to decrease. For this reason, caution should be taken when comparing the plasma and CSF glucose values in a patient with severe hyperglycemia.
Decreased CSF glucose levels (hypoglycorrhachia) can be the result of (1) disorder in carrier-mediated transport of glucose into CSF, (2) active metabolism of glucose by cells or organisms, or (3) increased metabolism by the CNS. The pathophysiological mechanism of altered transport remains unclear, but it is speculated to be the cause of hypoglycorrhachia in tubercular meningitis and sarcoidosis. Acute bacterial, amebic, fungal, and trichinosis meningitis are examples of glucose consumption by organisms, whereas diffuse meningeal neoplasia and brain tumor are examples of glucose consumption by CNS tissue. Consumption of glucose is usually accompanied by an increased lactate level due to anaerobic glycolysis by organisms or cerebral tissue.
Protein levels in CSF reflect the selective ultrafiltration of the CSF blood–brain barrier. All protein usually found in plasma is found in CSF but at much lower levels. Total protein is about 0.5%, or 1%, that of plasma but the specific protein concentrations in CSF are not proportional to the plasma levels because of the specificity of the ultrafiltration process. Because of this relationship of CSF and serum proteins, serum analysis should accompany CSF protein analysis.
A decreased level of CSF total protein can arise from (1) decreased dialysis from plasma, (2) increased protein loss (e.g., removal of excessive volumes of CSF), or (3) leakage from a tear in the dura, CSF otorrhea, or CSF rhinorrhea. The last reason is most common. A dural tear can occur as a result of a previous lumbar puncture or from severe trauma. Otorrhea and rhinorrhea refer to the leakage of CSF from the ear or into the nose, respectively. Identification of CSF leakage is best done by an analysis for β-transferrin, a protein unique to the CSF.
An increased level of CSF total protein is a useful nonspecific indicator of pathologic states. Increases may be caused by (1) lysis of contaminant blood from traumatic tap, (2) increased permeability of the epithelial membrane, (3) increased production by CNS tissue, or (4) obstruction. The presence of any amount of blood can elevate CSF protein levels because of the 200:1 concentration ratio. The blood–brain barrier becomes more permeable from bacterial or fungal infections. An increase in CNS production occurs in subacute sclerosing panencephalitis (SSPE) or multiple sclerosis (MS). There may also be combinations of permeability and production, with the collagen vascular diseases. An obstructive process, such as tumor or abscess, would also cause increased protein.
Diagnostically more sensitive information can be obtained by analysis of the protein fractions present. A comparison to the serum pattern is necessary for accurate conclusions. Under normal conditions, prealbumin is present in CSF in higher concentration than in serum. Although the respective proteins can be determined in both serum and CSF, the proteins of greatest interest are albumin and immunoglobulin G (IgG). Because albumin is produced solely in the liver, its presence in CSF must occur by means of blood–brain barrier passage. IgG, however, can arise by local synthesis from plasma cells within the CSF. The measurement of albumin in both serum and CSF is then used to normalize the IgG values from each matrix to determine the source of the IgG.
To determine the integrity of the blood–brain barrier, a CSF/serum albumin index is calculated as follows:
 (Eq. 29-1)
 An index value less than 9 indicates an intact blood–brain barrier.
This index can then be used to calculate the IgG index to determine CNS synthesis of IgG to aid the diagnosis of demyelinating diseases, such as MS and SSPE. MS is the most common inflammatory demyelinating disease of the CNS:
 (Eq. 29-2)
 The normal value is less than 0.73.
Increases in serum albumin cause increases in the CSF levels because of membrane permeability. However, increased CSF IgG, without concomitant CSF albumin increase, suggests local production (MS or SSPE). Increases in permeability and production are found with bacterial meningitis. Methods to analyze IgG and albumin CSF levels are the same as for serum but are optimized for the lower levels found.
Increased CSF protein levels or clinical suspicion usually indicates the need for electrophoretic separation of the respective proteins. At times, this separation demonstrates multiple banding of the IgG band. This observation is referred to as oligoclonal bands (a small number of clones of IgG from the same cell type with nearly identical electrophoretic properties). This occurrence is usually associated with inflammatory diseases and MS or SSPE. These types of disorders would stimulate the immunocompetent cells. The recognition of an oligoclonal pattern supersedes the report of normal protein levels and is a cause for concern if the corresponding serum separation does not demonstrate identical banding.
Another protein thought to be specific for MS is myelin basic protein (MBP). Initial reports suggested high specificity, but MBP has also been found in nondemyelinating disorders and does not always occur in demyelinating disorders. MBP levels are used to monitor therapy of MS. Current international guidelines for the diagnosis of MS recognize both an elevated IgG index and the presence of CSF oligoclonal bands that are not found in the serum as supporting evidence. Immunoassay procedures are available for analyzing MBP.3
Lactate is a useful indicator of anaerobic metabolism within the CSF. While the level of lactate in the CSF can potentially parallel that of the plasma, CSF elevations can occur independent of plasma concentrations under situations where anaerobic metabolism is occurring at an increased rate solely within the CNS. An increased lactate level with a normal to decreased glucose level has been suggested as a readily accessible indicator for bacterial meningitis. This finding is helpful in differentiating bacterial meningitis and other forms of infectious meningitis.4 Analysis of glucose and lactate in CSF is easily accomplished by techniques used for plasma and serum. It is important that provision for the analysis of glucose or lactate in CSF be immediate or that the specimen be preserved with an antiglycolytic, such as sodium fluoride.
Glutamine is formed by the combination of ammonia and glutamate. It is hypothesized that the synthesis of glutamine is a means to reduce ammonia levels within the central nervous system. While the level of ammonia within CSF is difficult to accurately determine due to its relative instability, the level of glutamine within a CSF samples is reflective of the amount of ammonia present within the central nervous system. Glutamate elevations are frequently seen in patients with hepatic encephalopathy along with various other pathologies.
CASE STUDY 29.1
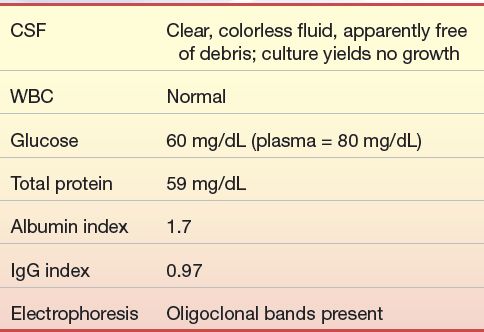
A 31-year-old man was in good health until about 1 year ago, after he began working as an accountant. Within the last year, he began to notice episodic blurring of vision, diplopia, mild vertigo, and headache. He complained of sensory loss in his hands and a feeling of weakness after physical exertion but thought that was just “out of shape.” He went to his physician after suffering leg and shoulder weakness accompanied by a feeling of paralysis, which was followed by a sensation of “pins and needles” in his left leg. Neurologic examination led to a spinal tap being performed for laboratory findings and a brain and spinal cord magnetic resonance imaging (MRI). His MRI showed demyelinating lesions, and other ancillary tests showed demyelinating damage to the auditory and visual pathway. The laboratory results were as follows:
Questions
1. What is the significance of the albumin index? The IgG index?
2. What pathology is consistent with these results?
SEROUS FLUIDS
The lungs, heart, and abdominal cavities are surrounded by two serous membranes: the parietal membrane lining the cavity wall and the visceral membrane lining the organs. Serous fluids, an ultrafiltrate of plasma, are located between the membranes. When serum dialyzes across these membranes, the fluid formed is called serous fluid—specifically, pleural (lung), pericardial (heart), and peritoneal (abdominal) fluid.
The formation of serous fluid is a continuous process driven by the hydrostatic pressure of the systemic circulation and maintenance of oncotic pressure due to protein. The potential space is usually fluid filled with no gases present. The fluid reduces or eliminates friction caused by expansion and contraction of the encased organs.
Serous fluids, along with other extracellular fluids, account for 45% of the body’s water volume and share common characteristics in regard to their chemical composition.5 Various forces control the movement of fluids within the different extracellular compartments of the body. The tissue’s colloidal osmotic pressure (interstitial fluid pressure), along with the capillary’s hydrostatic pressure (filtration pressure), regulates the outward flow of fluid from the capillary. The colloidal osmotic pressure of the capillary and the tissue’s hydrostatic pressure regulate the inward flow of fluid into the capillary from the tissue.6 Figure 29.5 illustrates the direction of these forces. Furthermore, the lymphatic system removes the fluids entering into the interstitial space. Figure 29.6 shows the normal flow of fluids among the bloodstream, tissues, and lymphatic vessels.
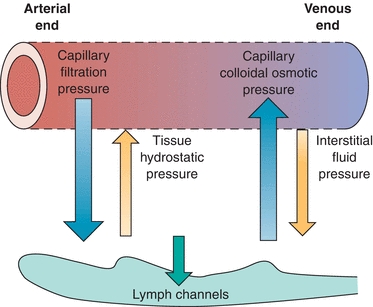
FIGURE 29.5 Forces governing the exchange of fluid at the capillary level.
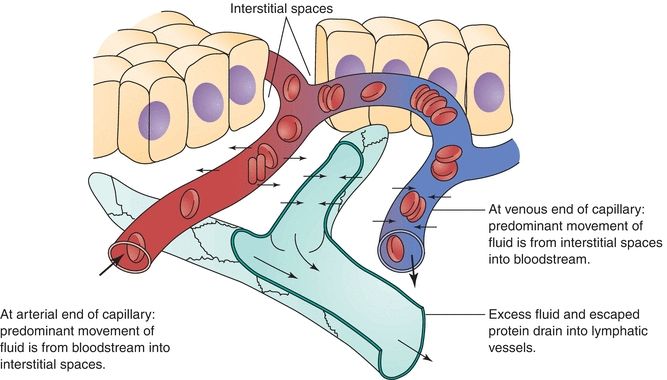
FIGURE 29.6 Exchanges through capillary membranes in the formation and removal of interstitial fluid.
Examining these biochemical and cellular alterations that occur to serous fluids can assist in diagnosing and monitoring the patient’s condition.7 Such alterations occur due to an imbalance in pressures that lead to excessive egress of fluid into tissue spaces that cause an accumulation of fluid that when noted is the typical indication for analysis of the serous fluid. This accumulation is called an effusion. Effusions are further classified as transudate or exudate. Proper classification of effusions is critical to patient care.
A transudate may occur during various systemic disorders that disrupt fluid filtration, fluid reabsorption, or both. Conditions such as congestive heart failure, hepatic cirrhosis, and nephrotic syndrome are examples of systemic disorders that may result in the formation of transudates. Exudate effusions occur during inflammatory processes that result in damage to blood vessel walls, body cavity membrane damage, or decreased reabsorption by the lymphatic system. Infections, inflammations, hemorrhages, and malignancies are examples of pathologic processes that can cause the formation of exudates. The formation of transudates and exudates can damage tissues and body cavity membranes and alter lymphatic function.
Various laboratory tests are used to differentiate between transudates and exudates, including fluid appearance, specific gravity, amylase, glucose, lactate dehydrogenase (LD), and proteins. Additional tests such as ammonia, lipids, and pH may be useful in confirming the cause of an effusion for specific body sites.
Pleural Fluid
The outer layer of the pleural space, the parietal layer, is served by the systemic circulation and the inner layer, the visceral layer, by the bronchial circulation. As with all serous fluids, pleural fluid is formed by the ultrafiltration of plasma through the parietal layer and is essentially interstitial fluid of the systemic circulation. With normal conditions, there is 3 to 20 mL of pleural fluid in the pleural space. The fluid exits by drainage into the lymphatics of the visceral pleura and the visceral circulation. Any alteration in the rate of formation or removal of the pleural fluid affects the volume, causing an effusion.
Once an effusion is identified, it is then necessary to classify the nature of the effusion by analysis of the pleural fluid. The fluid is removed from the pleural space by needle and syringe after visualization by radiology. This procedure is called thoracentesis; the fluid is called thoracentesis fluid or pleural fluid (Fig. 29.7). Samples are collected as follows: a heparinized tube for culture, an ethylenediaminetetraacetic acid (EDTA) tube for microscopy, a sodium fluorescein (NaF) tube for glucose and lactate, and a nonanticoagulated tube for further biochemical testing.
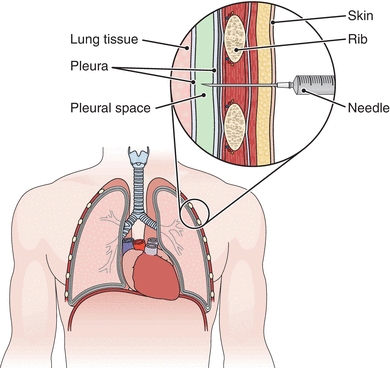
FIGURE 29.7 Thoracentesis. A needle is inserted into the pleural space to withdraw fluid. (From Cohen BJ. Medical Terminology. 4th ed. Philadelphia, PA: Lippincott Williams & Wilkins; 2004.)
Transudates are secondary to remote (nonpleural) systemic pathologies and exhibit biochemical and cellular abnormalities consistent with noninflammatory changes in fluid dynamics within the pleural space. An example would be hypoproteinemia due to malnutrition leading to decreased oncotic pressure and subsequent decrease in fluid reabsorption into the capillaries. An exudate indicates primary involvement of the pleura and lung, such as infection, and demands immediate attention. An example of an exudative process would be infection-mediated damage to the membranes, allowing increased fluid entry into the pleural space (Table 29.1).
TABLE 29.1 Causes of Pleural Effusions
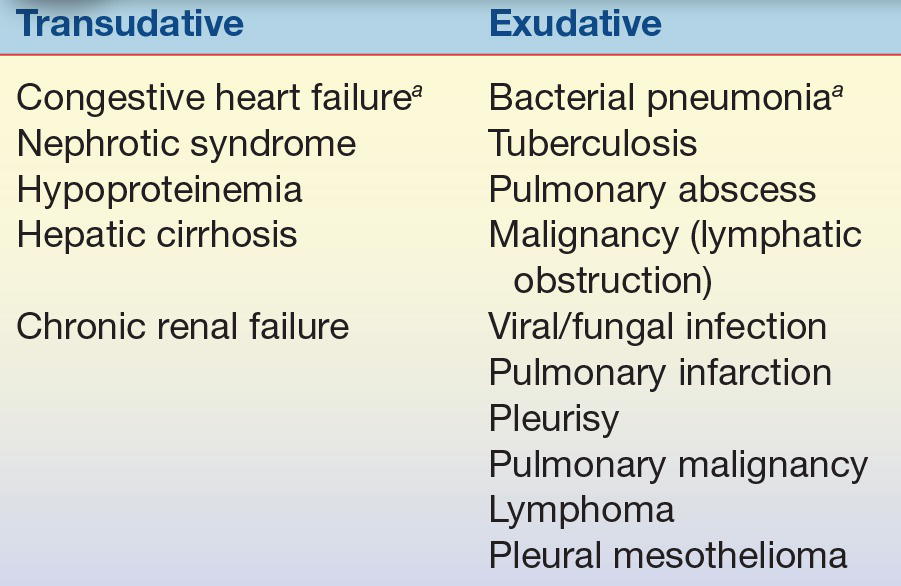
aMost common cause.
The assignment of fluid to either the transudate or exudate category had previously been based on the protein concentration of the fluid. This criterion has been replaced by the use of a series of fluid/plasma (F/P) ratios known as Light’s criteria. This criteria specifically state that if the F/P ratio for total protein is greater than 0.5 or the ratio for LD is greater than 0.6 (or the pleural fluid LD/upper limit serum LD ratio reference interval is >0.67), the fluid is an exudate. For pleural fluid, an additional characterization can be made by determining the pleural fluid cholesterol, the fluid-to-serum cholesterol ratio, and the fluid-to-serum bilirubin ratio. Exudates are indicated by fluid cholesterol greater than 60 mg/dL, fluid-to-serum cholesterol ratio greater than 0.3, and fluid-to-bilirubin ratio of 0.6 or higher.
Further characterization of the exudate by the chemistry laboratory may involve analysis for glucose, lactate, amylase, triglyceride, or pH. A decrease in glucose or increase in lactate would suggest infection or inflammation. An increase in amylase compared with that of serum suggests pancreatitis. Grossly elevated triglyceride levels (2 to 10× serum) could indicate thoracic duct leakage. The use of pH measurements, performed as one would perform a blood–gas level determination, has gained favor. Succinctly, pH less than 7.2 suggests infection, and pH close to 6.0 indicates esophageal rupture. The methodologies for these analyses are the same as those employed for the serum and blood constituents and, therefore, are feasible in the clinical laboratory.
Pericardial Fluid
The relationship of the pericardium, pericardial fluid, and the heart is similar to that with the lungs and pleural fluid. Mechanisms of formation and drainage are the same. Pericardial effusions are an accumulation of fluid around the heart caused by damage to the mesothelium and are usually always exudates. Figure 29.8 illustrates the pericardium surrounding the heart. Normally, the pericardium contains less than 50 mL of fluid. The procedure for removing excess pericardial fluid, pericardiocentesis, is dangerous and therefore rarely performed (Fig. 29.8). However, this procedure is necessary to obtain a sample if cultures are needed to investigate an infection or if cytology is needed for suspected malignancy.8 Adenosine deaminase testing may also be requested in suspected cases of tubercular effusions.
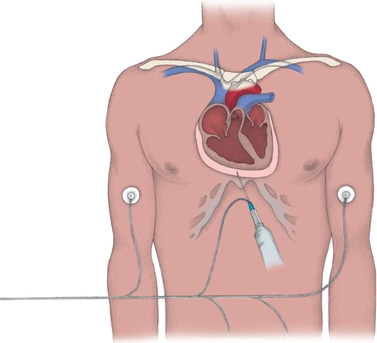
FIGURE 29.8 Aspirating pericardial fluid. In pericardiocentesis, a needle and a syringe are inserted through the chest wall into the pericardial sac (as shown below). Electrocardiographic monitoring, with a lead wire attached to the needle and electrodes placed on the limbs (right arm, left arm, and left leg), helps ensure proper needle placement and avoids damage to the heart. (From Nursing Procedures. 4th ed. Ambler, PA: Lippincott Williams & Wilkins; 2004.)
Stay updated, free articles. Join our Telegram channel

Full access? Get Clinical Tree


